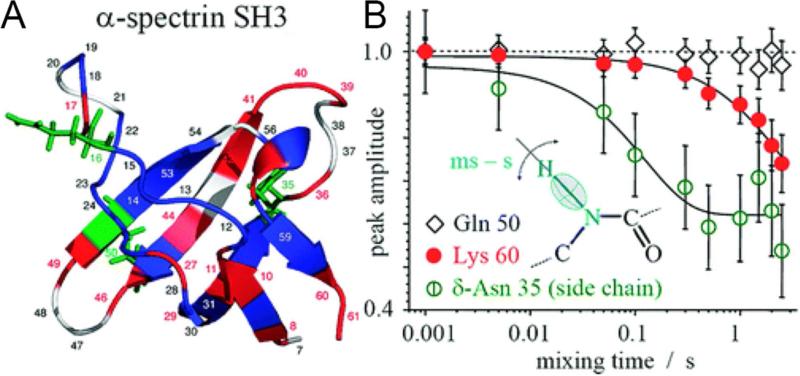
Figure 2.
Mobility in SH3. A) Structure of the α-spectrin SH3 domain with color-coded residue mobility: blue indicates immobile residues, and red (backbone) and green (side chains) indicate mobile residues. Residues that are unassigned or not seen in the spectrum are white. B) Examples of τm dependences for residues undergoing (Lys 60 and δ-Asn 35) and not undergoing (Gln 50) slow motions. The lines are exponential fits. Reproduced from A. Krushelnitsky, E. deAzevedo, R. Linser, B. Reif, K. Saalwächter, D. Reichert, Journal of the American Chemical Society 2009, 131. 12097-12099, DOI: 10.1021/ja9038888. Copyright 2009 American Chemical Society.

