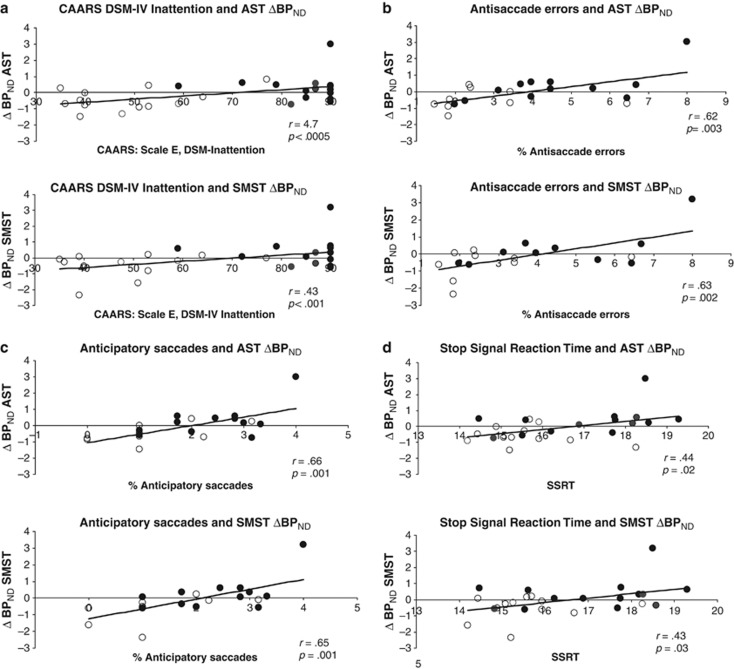
Figure 2.
Associations of ΔBPND with ADHD symptoms on the CAARS and response inhibition. Associations between ΔBPND and (a) CAARS DSM-IV Inattention symptoms; (b) % antisaccade errors; (c) % anticipatory saccades; and (d) stop signal reaction times. Open symbols represent controls and filled symbols represent ADHD participants. CAARS DSM-IV Inattention t-scores and square root transformed values for neurocognitive performance appear on the x axis; residualized ΔBPND values, removing the effect of intake BDI, appear on the y axis. More positive values represent greater d-amph-induced BPND decreases (greater DA release). Note that the correlations are not driven by the ADHD participant in the upper right of the graphs and remain significant with nonparametric analyses.

