Figure 4.
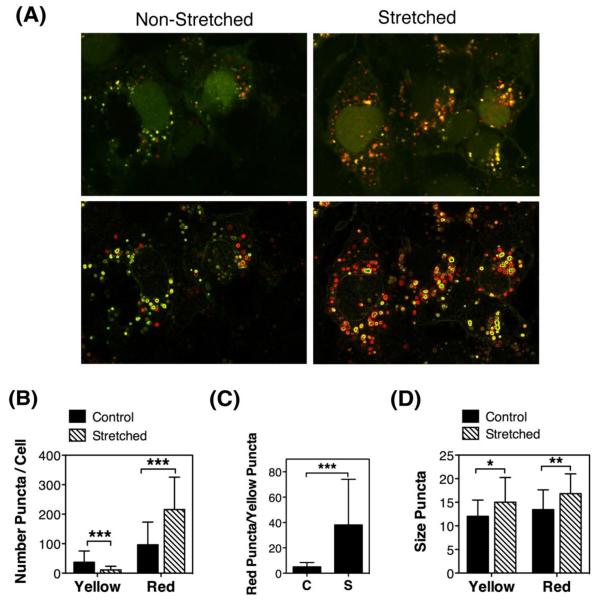
Autophagic flux in mechanically stressed TM cells evaluated by tfLC3: Primary cultures of TM cells were infected with AdtfLC3 (m.o.i = 10 pfu/cell). At 2 d.p.i., cells were subjected to mechanical stress (20% elongation, 1 hour). (A) Representative confocal images showing the presence of yellow and red puncta in non-stretched and stretched cells. Bottom panels represents the top panel pictures processed with the Find Edges tools in Image J to facilitate manual counting. (B) Number of yellow and red puncta per cell. (C) Autophagic flux measurement as a ratio of red/yellow puncta per cell. (D) Size of yellow and red puncta. Data are means ± SD of three independent experiments, ten cells/experiment, n = 30, *p<0.05, **p < 0.00, *** p < 0.0001, t-test.

