
Figure 12.
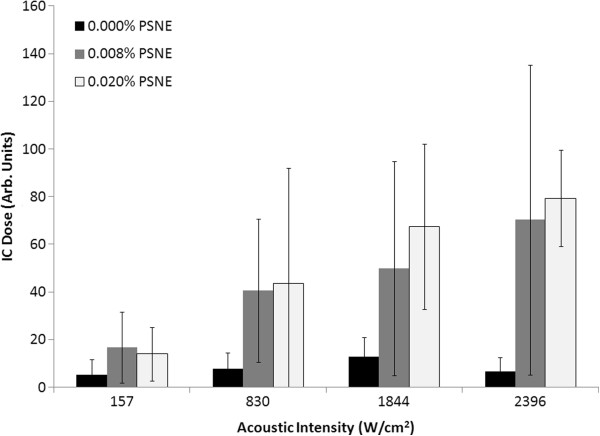
Inertial cavitation dose at different acoustic intensities and PSNE concentrations. The inertial cavitation dose corresponds to the tests in Figure 10. The inertial cavitation dose increased with acoustic intensity and was greater in gel phantoms that contained vaporized PSNE. Error bars represent the standard deviation from five measurements.