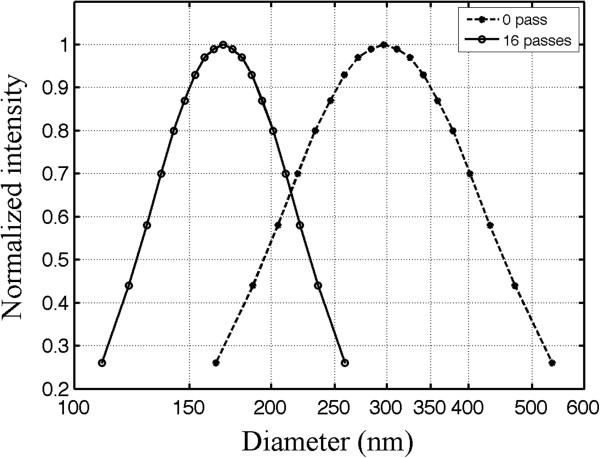
Figure 4.
The size distribution of nanoemulsion particles before and after extrusion. The dashed line represents the distribution before extrusion, and the solid line indicates the distributions after extruding 16 times through polycarbonate membrane filters with a 200-nm pore size. Extrusion produced PSNE with a smaller mean diameter and a narrower size distribution. The measurement uncertainty was 1.1% (calculated from the variation in mean size after repeating the measurement five times with the same sample).

