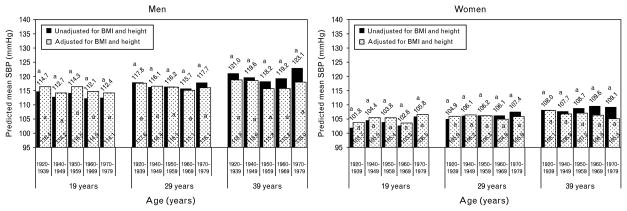
Fig. 1.
Predicted mean SBP before (black bars) and after adjusting for BMI and height (white dotted bars). Means with different letters (a,b,c) are significantly (P <0.05) different from each other, within each model and age group, stratified by sex, after adjusting for multiple testing using Holm–Bonferroni.

