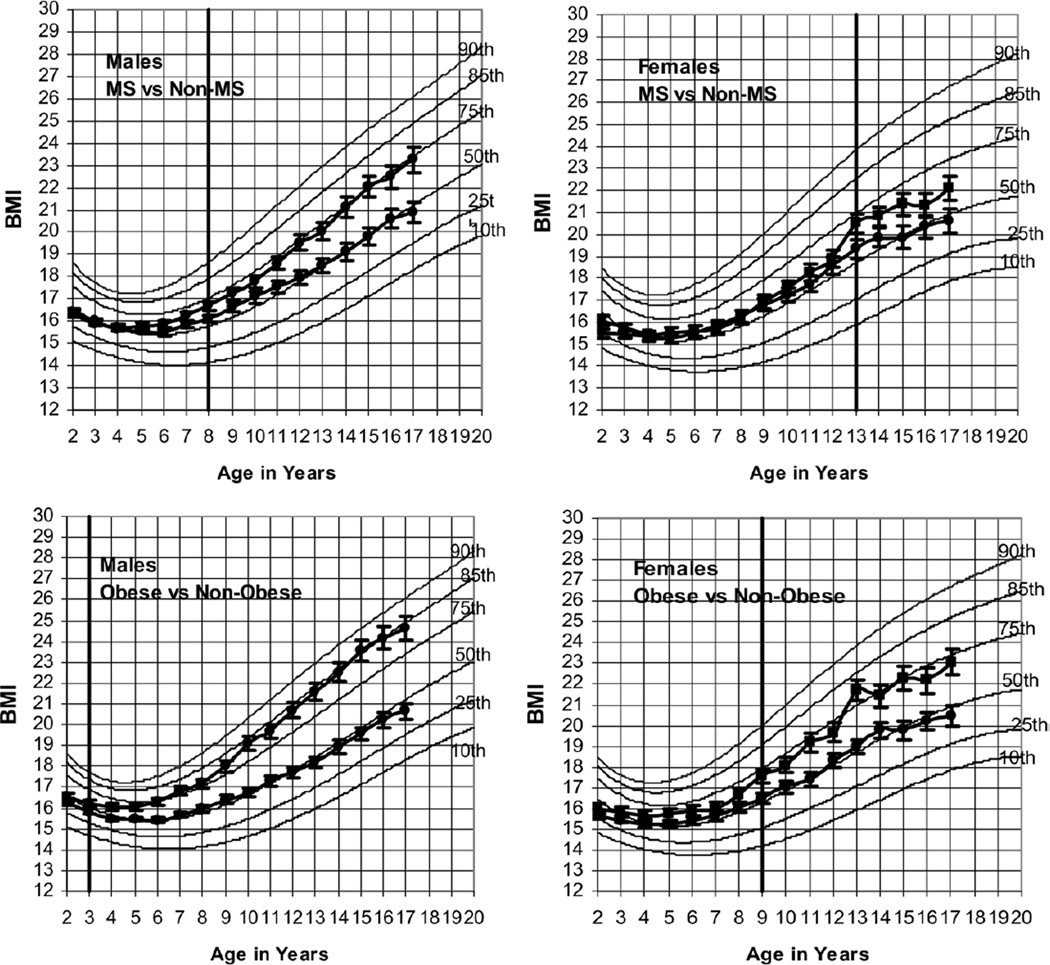
Figure 1.
Means and standard deviations of BMI in childhood of men and women in the Fels Study with and without the metabolic syndrome (MS) [upper panels] and with or without BMI ≥30 kg/m2 in adulthood [lower panels] plotted on selected BMI percentiles of US CDC growth charts. Data estimated from random effects models with adjustments for birth weight and relative bone age. Vertical lines intersecting the growth curves indicate age at which significant divergence first appears between subjects who will develop the metabolic syndrome [upper panels] or BMI ≥30 kg/m2 [lower panels] in adulthood and those who will not.

