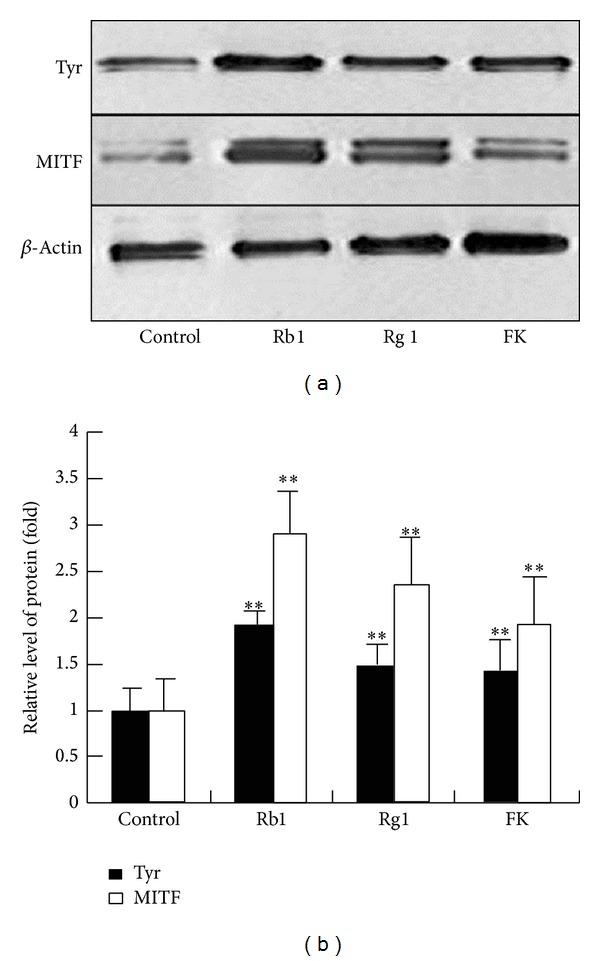
Figure 2.

Ginsenosides Rb1 and Rg1 upregulated expression of MITF and tyrosinase. Cells were treated with Rb1 (100 μM), Rg1 (300 μM), or 10 μM forskolin (FK, used as a positive control) for 24 hrs. The expression levels of MITF and tyrosinase (Tyr) proteins (a) were quantified and normalized to the level of β-actin by western blotting analysis. The normalized data for each was plotted as bar graphs (b). Data are expressed as the mean ± SD from three independent experiments carried out in triplicate. **P < 0.01, compared with the control (as determined by one-way ANOVA). These experiments were conducted with melanocytes cultured from three different donors.
