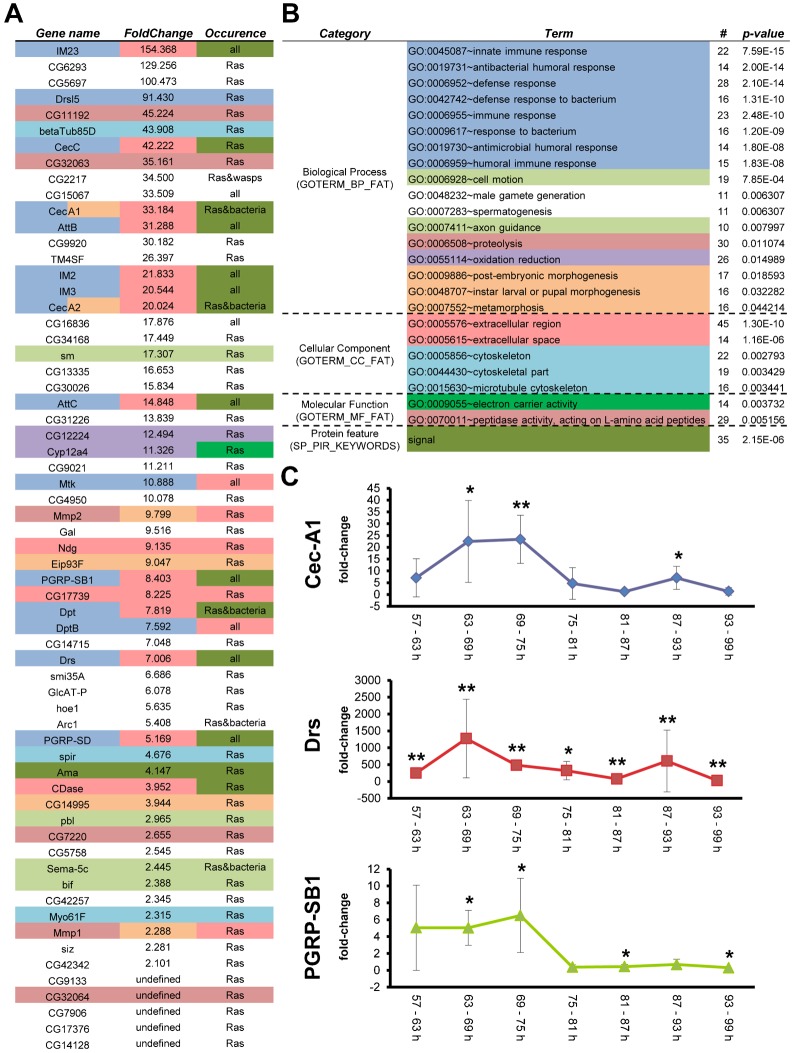
Fig. 4. Induction of a systemic immune response in RasV12-expressing larvae.
(A) List of genes that are significantly induced (at q<0.05 and induction level >10) in the RasV12-expressing glands (40 larvae were used for each replicate). (B) The fat body transcription profile of RasV12-expressing larvae shows the hallmarks of an immune response GO classification of genes that are differentially expressed after Ras expression was performed using DAVID (see Materials and Methods for details). The most significant classifications are indicated (see supplementary material Table S2 for a more extensive list of annotations. (C) Induction kinetics of selected immune genes in RasV12-expressing larvae. Individual analysis of a Toll-regulated (Drosomycin) and two preferentially imd-dependent genes (Cecropin A1 and PGRP-SB1) confirms their differential regulation and reveals a complex pattern during the course of the 3rd instar. The ratio of expression between RasV12-expressing and control larvae was determined at the indicated time points after hatching. (Significance levels are: for CecA1: 0.0831; 0.0013; 0.0403 for Drs: 0.0015; 0.0035; 2.15 E−6; 0.0374; 0.0001; 0.0097; 0.0015 and for PRGP-SB1: 0.0151; 0.0167; 0.0321; 0.0436, Student T-test; unpaired, equal variance.)

