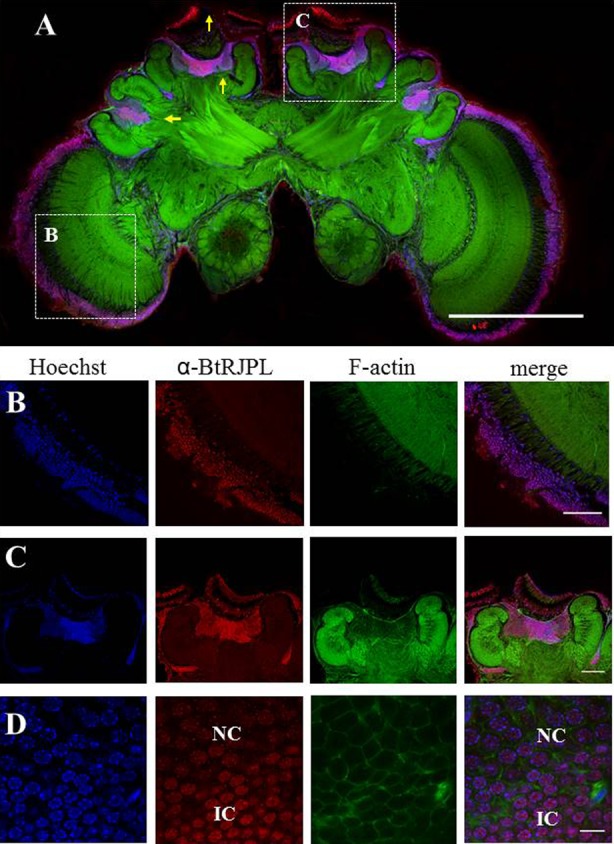
Fig. 7. BtRJPL expression in the bumblebee brain.

(A) Overview of a frontal section of a worker brain immunolabeled with α-BtRJPL antibodies (red), DNA stain (Hoechst, blue) and phalloidin against the filamentous actin (green). Strong BtRJPL-ir was found in Kenyon cells, cell bodies in the optic lobe and ocelli (yellow arrows). Boxes indicate areas shown in panels B and C (different samples). (B) BtRJPL-ir of cell bodies in the first chiasm of the optic lobes. (C) Detailed view of the median calyx. Both the cell bodies of the inner and clawed Kenyon cells are immunoreactive. (D) Differences in BtRJPL-ir intensity can be seen between inner compact cells (IC) and non-compact cells (NC). Scale bars: 500 µm (A), 100 µm (B,C), 10 µm (D).
