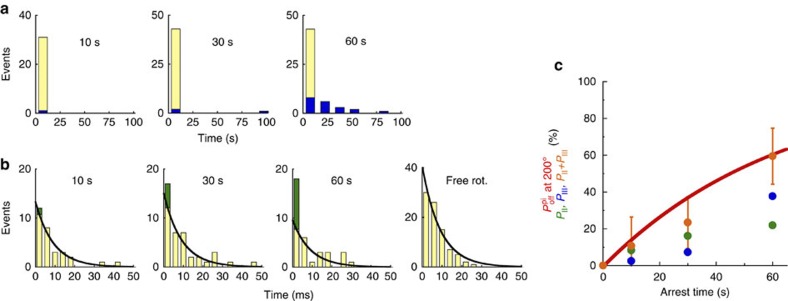
Figure 3. Analysis of the effect of Pi release at 200°.
(a,b) Histograms of the dwell time at 320° after the release from 200° arrest for 10 s, 30 s, and 60 s, or during free rotation. The bin sizes of the histogram are 15 s for a and 4 ms for b. Blue bars in a represent the number of pauses longer than 100 ms (behaviour (III)). The data after first bin in b were well-fitted by the single exponential curve where τ=9 ms (Pi release dwell at 320°). The deviations of the first bins from the single exponential curves are coloured green (behaviour (II)). (c) Probability of Pi release at 200°. The red solid line presents the simulation curve for Pi release calculated from the analysis of PON based on the kinetic scheme as follows: F1·ATP↔ F1·(ADP+Pi)→F1·ADP+Pi. Green, blue and orange points represent the probability of occurrence of II (PII), III (PIII) and their sum (PII+PIII), respectively. PII and PIII were determined from the analysis of b and a, respectively.

