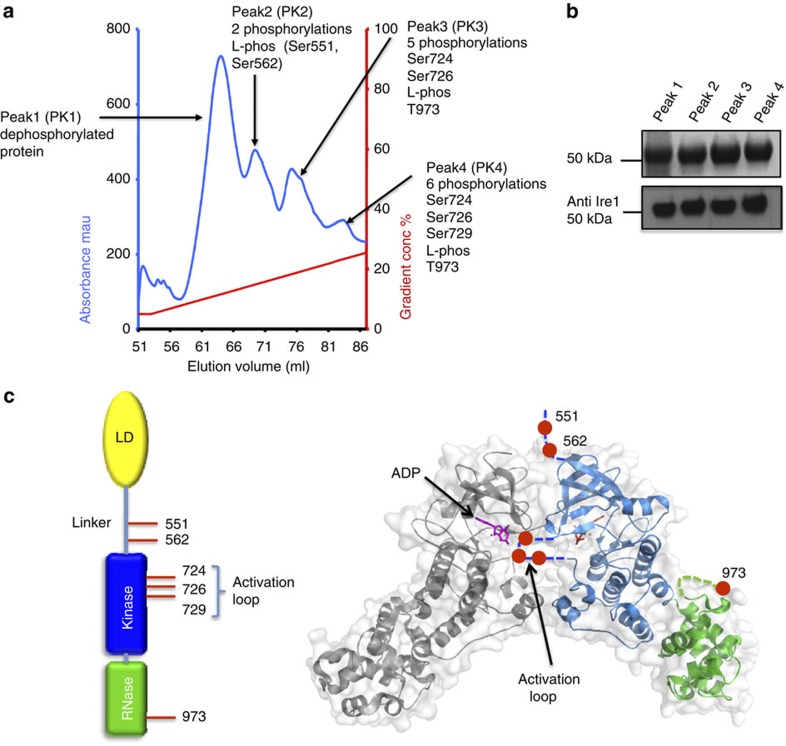
Figure 1. Identification of phosphorylation sites.
Chromatogram showing the elution profile of human Ire1 protein (547–977) expressed in insect cells and passed through a monoQ anion exchange column. The four peaks indicated distinct phosphorylated species of Ire1, and their sites of phosphorylation were identified by mass spectrometry (see Supplementary Figs 1,2, Supplementary Table 1). (b) Ire1 protein (547–977) samples from the four distinct peaks isolated by anion exchange were visualized by SDS-PAGE (top panel) and by western blot using a generic human Ire1 antibody (bottom panel). (c) The position of phospho sites relative to each other and mapped onto the X-ray structure of human Ire1 autophosphorylation complex (3P23).

