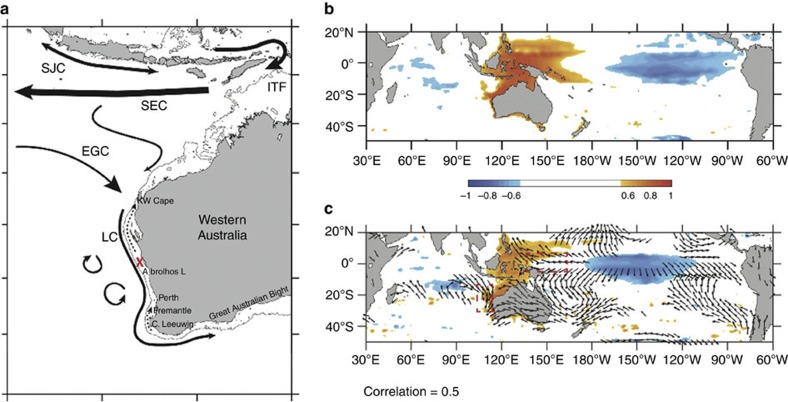
Figure 1. Regional surface ocean properties in the Indo-Pacific.
(a) Regional surface ocean currents in the eastern Indian Ocean (modified after7). ITF, Indonesian throughflow; SJC, South Java Current; SEC, South Equatorial Current; EGC, East Gyral Current; LC, Leeuwin Current; dotted arrows, inshore currents. The 200 m isobath of bottom topography is shown as solid line. The X (red) indicates the location of the Houtman Abrolhos Islands. Fremantle is indicated where the sea-level station record was established. (b) Spatial correlation of annual Fremantle sea level (FSL) with global sea surface height (SSH) from Simple Ocean Data Assimilation (SODA) 2.0.4 (ref. 40) for the calendar year January–December for 1981–2010. (c) Houtman Abrolhos Islands (HAI) regional SST spatial correlation with global sea surface height (SSH, in colour) from SODA 2.0.4 (ref. 40), and zonal/meridional wind speed and vectors from twentieth century reanalysis22 (arrows proportional to correlation with HAI SST). The rectangular box (stippled red) in the West Pacific called WPZW in c indicates the area where Western Pacific Zonal wind stress (3°S-3°N, 130–160°E) is highly correlated with HAI OI SST. The box off WA (stippled red) in c shows the location of meridional wind changes (MW WA, 20–30°S, 110–116°E) of importance for HAI SST. Arrows in c point to dominant wind direction for wind speed anomalies. Only correlations with P<0.05 are shown in colour. Correlations computed at http://climexp.knmi.nl41.

