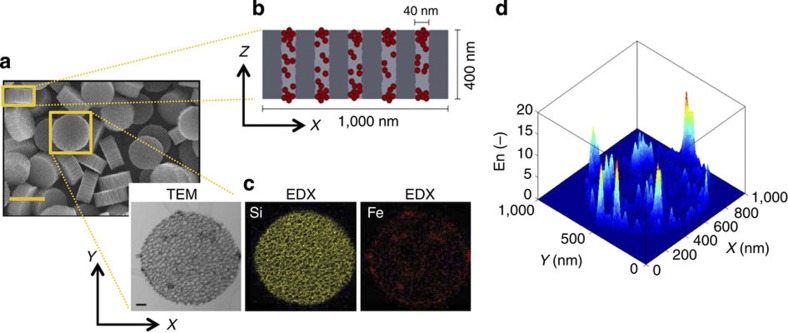
Figure 5. Relaxivity of SPIO-loaded mesoporous silicon nanoconstructs.
(a) Scanning electron microscopy image of discoidal mesoporous silicon nanoconstructs (with cross section area 1000 × 400 nm2) loaded with 5 nm SPIOs. Scale bar, 1 μm. (b) Schematic representation of the pores within the silicon nanoconstructs loaded with the SPIOs (red circles). (c) TEM and EDX images showing the distribution of SPIO clusters within the silicon nanoconstructs. The black dots in the TEM image and red dots in the EDX image identify the SPIOs; the yellow lines in the EDX image represent the Si walls of the mesoporous silicon nanoconstructs. Scale bar, 100 nm. (d) Diagram showing the local enhancement in transversal magnetic resonance relaxivity as calculated via the D(θ) relationship.

