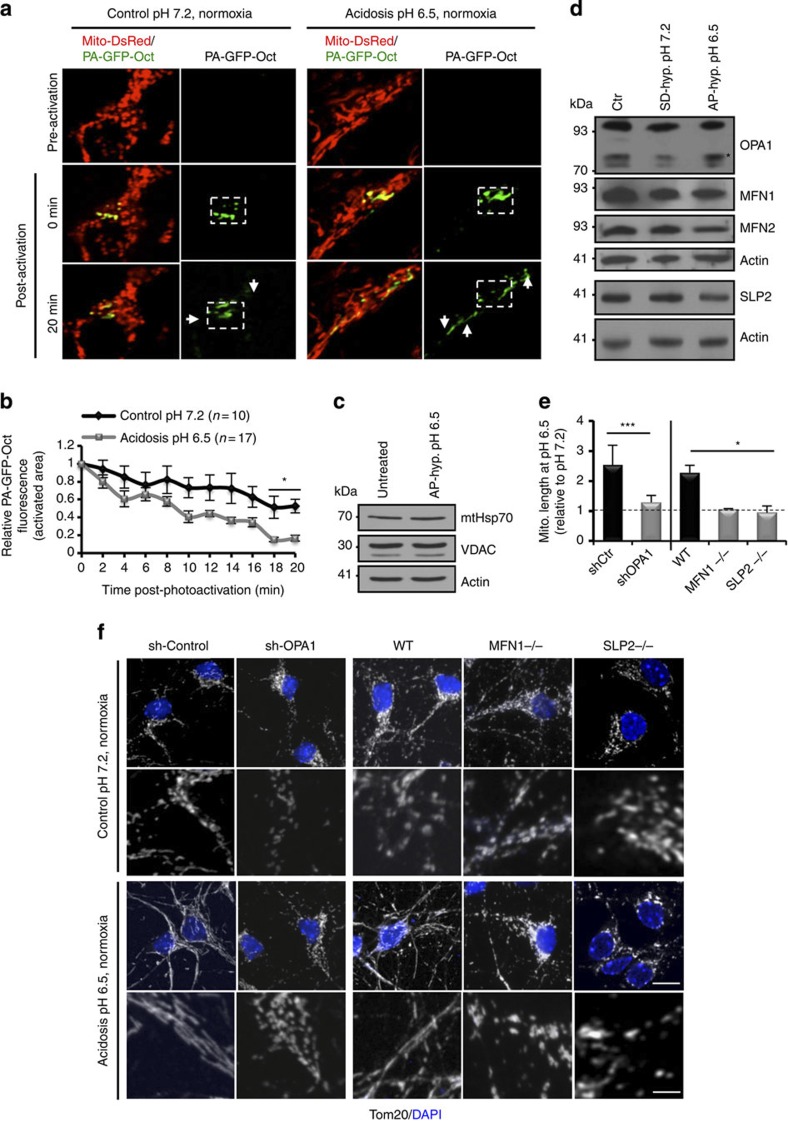
Figure 4. Mild acidosis regulates mitochondrial dynamics.
(a) Representative images of mitochondrial fusion over time (indicated in minutes) following activation of exogenously expressed PA-GFP-Oct. Boxes indicate photo-activated regions and arrows indicate spread of the GFP signal within mitochondria (revealed by exogenous expression of Mito-DsRed). (b) Quantification of mitochondrial fusion in cortical neurons as a loss of GFP fluorescence in the activated region. Data represent the mean and s.d. of n=10 (control) and n=17 (experimental) from three independent experiments. (c and d) Western blot of the indicated proteins from whole-cell lysates of cortical neurons incubated for 6 h at the indicated conditions. Asterisk indicates s-OPA1. (e) Mean and s.d. (n=3) of mitochondrial length during acidosis, of the indicated genotypes, relative to control conditions. (f) Representative images of mitochondrial morphology from cortical neurons of the indicated genotypes following 6-h incubation in MES-buffered media at the indicated conditions. Bottom panel of each condition is a zoom view of mitochondria. Scale=10 μm. *P<0.05; ***P<0.001 (Student’s t-test).

