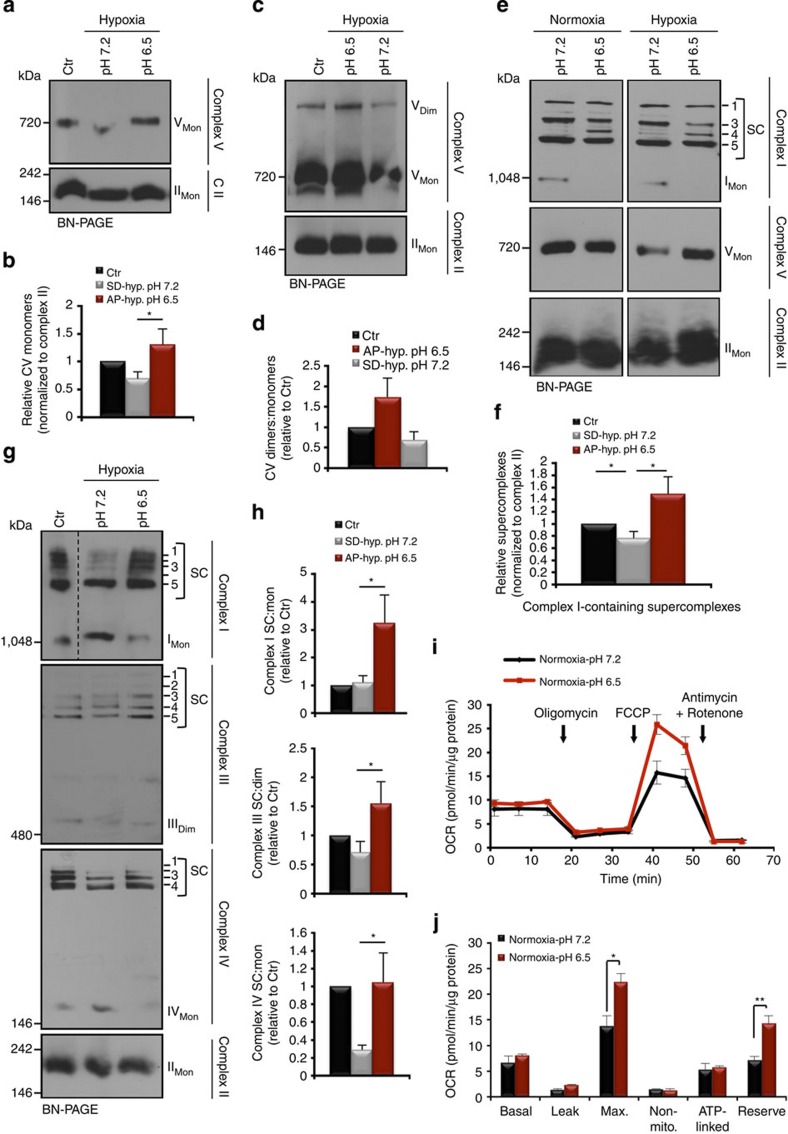
Figure 8. Acidosis instigates an adaptive reprogramming of mitochondrial respiratory efficiency.
(a–d) Representative BN-PAGE of Complex V (ATP synthase) (a) monomers (whole cells) and (c) dimers (isolated mitochondria) in cortical neurons following 6-h treatment in the indicated conditions. In (c), longer exposure of the membrane was required to visualize the dimeric Complex V. Graphs represent mean and s.e.m of (b) n=5 and (d) n=3 independent experiments. Mon=monomers, Dim=dimers, and CV=Complex V. (e) Representative BN-PAGE of the indicated respiratory complexes using anti-NDUFA9 (Complex-I), anti-ATP5a (Complex-V) and anti-Core2 (Complex-II). Cortical neurons were treated for 6 h in the indicated conditions. SC 1–5=supercomplex assembly. (f) Quantification of relative assembly of supercomplexes visualized using anti-NDUFA9 (Complex-I). Mean and s.e.m of n=4 independent experiments. (g,h) Representative BN-PAGE of the indicated respiratory complexes using anti-NDUFA9 (Complex-I), anti-UQCRC2 (Complex-III), anti-Complex IV subunit 1 (Complex-IV) and anti-Core2 (Complex-II) following 6 h in the indicated conditions. Graphs in (h) are mean and s.e.m of n=6 (Complex-I), n=4 (Complex-III) and n=3 (Complex-IV) independent experiments. (i,j) OCR in cortical neurons using a Seahorse XF24 Extracellular Flux Analyzer. Mean and s.d. (n=4 replicates from three independent experiments). *P<0.05; **P<0.01; ***P<0.001 (Student’s t-test).

