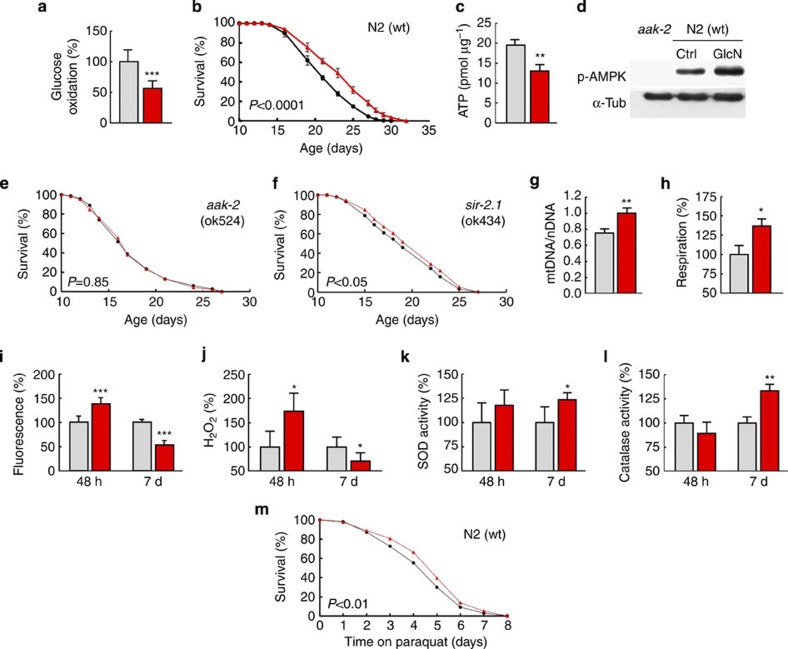
Figure 1. GlcN induces mitochondrial metabolism and extends C. elegans life span.
(a) Glucose oxidation rates in control wild-type (wt) nematodes (grey) and wild-type nematodes exposed to GlcN (red) (P<0.001, Student’s t-test, n=6); colour coding applies to all subsequent panels and figures. (b) Life expectancy of untreated wild-type-nematodes and GlcN-treated C. elegans (P<0.0001, log-rank test, n=3). (c) ATP content at different time points in GlcN- and untreated nematodes (P<0.01, Student’s t-test, n=3). (d) Representative western blot of whole-worm lysates in the presence and absence of GlcN in wild-type worms, as well as untreated AAK-2-deficient worms. (e) Life span assay on AAK-2-deficient nematodes in the presence and absence of GlcN (P=0.85, log-rank test, n=3). (f) Life span assay on SIR-2.1-deficient nematodes (P<0.05, log-rank test, n=3). (g) mtDNA content normalized to nuclear DNA content in whole worms in the presence and absence of GlcN (P<0.01, Student’s t-test, n=3). (h) Relative respiration rates of whole worms (P<0.05, Student’s t-test, n=3), and (i) relative MitoTracker Red CM-H2X fluorescence of whole worms in the presence and absence of GlcN at different time points (P<0.001, Student’s t-test, n=3). (j) Relative Amplex Red fluorescence in suspensions of alive nematodes (P<0.05, Student’s t-test, n=3). (k) Relative superoxide dismutase activities (P<0.05, Student’s t-test, n=3). (l) Relative catalase activities (P<0.01, Student’s t-test, n=3); and (m) survival on PQ exposure, all in the presence and absence of GlcN, respectively (P<0.01, log-rank test, n=3). The bars represent the mean+s.d. *P<0.05, **P<0.01, ***P<0.001 versus control.

