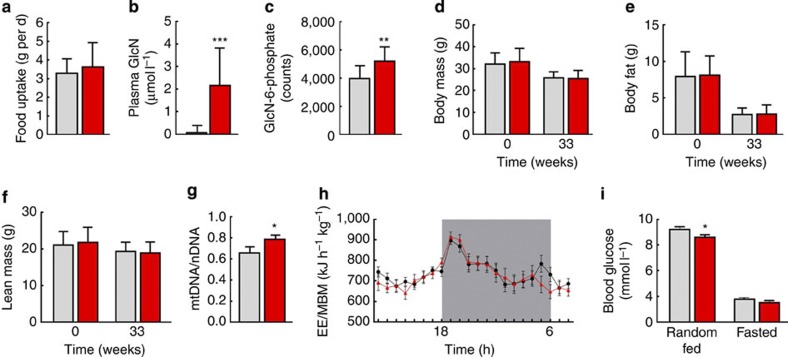
Figure 4. Metabolic consequences of GlcN supplementation.
(a) Food uptake of C57BL/6-NRj mice (both sexes) chronically exposed to GlcN (red) and respective controls (grey). (b) Plasma levels of GlcN in mice (both sexes) on a GlcN-containing diet in comparison with control mice (F(1,33)=27.67, P<0.001, n=18 control mice and n=19 GlcN-fed mice). (c) Hepatic levels of GlcN-6-phosphate (F(1,16)=8.74, P<0.01, n=10 control mice and n=10 GlcN-fed mice). (d–f) Body mass and body composition parameters in such mice. (g) Relative mtDNA content in liver specimen (F(1,21)=5.05, P<0.05, n=12 control mice and n=13 GlcN-fed mice). (h) Energy expenditure normalized to metabolic body mass of such mice; calculated means for every hour during day, grey area reflects dark phase of the light cycle. (i) Random fed (F(1,36)=4.49, P<0.05, n=20 control mice and n=20 GlcN-fed mice) as well as fasting blood glucose levels in such mice. Controls are always depicted in black and grey colour, whereas GlcN-treatment is depicted in red. The bars represent the mean+s.d. *P<0.05, **P<0.01, ***P<0.001 versus control; two-way ANOVA.

