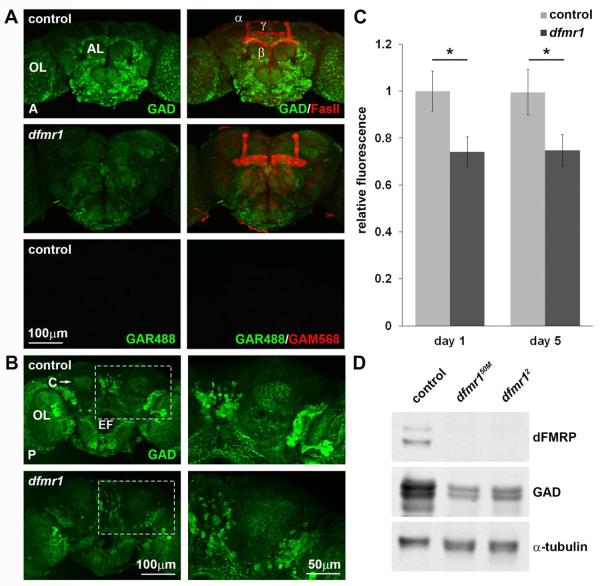
Figure 1. Null dfmr1 mutant brains display depressed GAD protein levels.
A) Adult Drosophila control (w1118) and dfmr1 null (dfmr150M) brains labeled with anti-GAD (green) and anti-FasII (red) imaged from anterior (A). Optic and antennal lobes (OL and AL, respectively) and MB α, β, and γ lobes are indicated. A secondary antibody control shows no labeling (goat-anti-rabbit 488 (GAR488, green) and goat-anti-mouse 568 (GAM568, red)). B) Brains labeled with anti-GAD (green) imaged from the posterior (P). The calyx (C), optic lobe (OL), and esophageal foramen (EF) are labeled for spatial orientation. The dashed rectangular area, including the right-side MB calyx region, is shown at higher magnification on the right. C) GAD immunolabeling intensity quantification at day 1 and 5 post-eclosion normalized to w1118 control. Error bars represent s.e.m. Significance is shown at p<0.05 (*). D) Representative anti-GAD Western blot of isolated adult brains at 1 day post-eclosion. Top row shows dFMRP loss in two independent null alleles (dfmr150M, dfmr12) compared to control (w1118). Middle row shows GAD reduction in both mutants. α-tubulin serves as the loading control.

