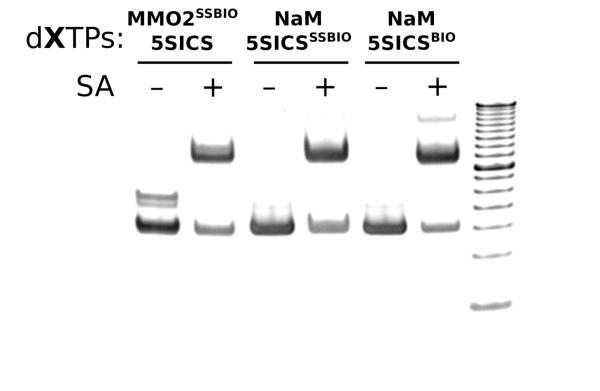
Figure 2.
PCR fidelity determination via gel mobility. Based on the intensity of the DNA band that shifts in the presence of added streptavidin (SA), the biotin incorporation level is 65% for dMMO2SSBIO-d5SICS, 64% for dNaM-d5SICSSSBIO, and 72% for dNaM-d5SICSBIO. (Note that the slightly slower migrating band in lane 1 corresponds to unbiotinylated single-stranded DNA resulting from incomplete annealing after PCR.) The overall incorporation levels are converted to fidelities (Table 2) by normalizing by the number of doublings. A 50 bp DNA ladder is loaded in the rightmost lane.

