Abstract
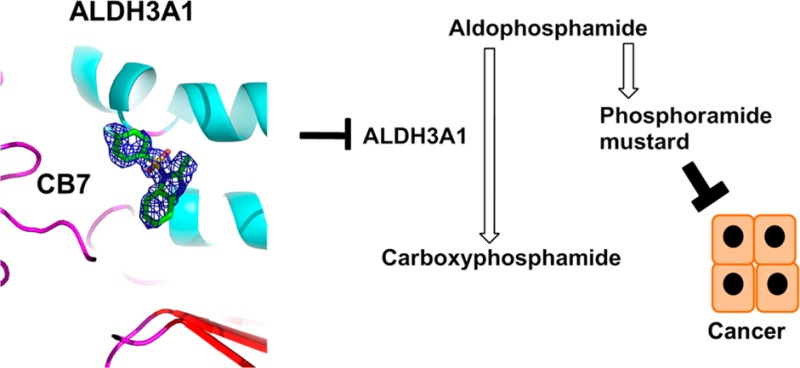
Aldehyde dehydrogenase enzymes irreversibly oxidize aldehydes generated from metabolism of amino acids, fatty acids, food, smoke, additives, and xenobiotic drugs. Cyclophosphamide is one such xenobiotic used in cancer therapies. Upon activation, cyclophosphamide forms an intermediate, aldophosphamide, which can be detoxified to carboxyphosphamide by aldehyde dehydrogenases (ALDH), especially ALDH1A1 and ALDH3A1. Consequently, selective inhibition of ALDH3A1 could increase chemosensitivity toward cyclophosphamide in ALDH3A1 expressing tumors. Here, we report detailed kinetics and structural characterization of a highly selective submicromolar inhibitor of ALDH3A1, 1-[(4-fluorophenyl)sulfonyl]-2-methyl-1H-benzimidazole (CB7, IC50 of 0.2 μM). CB7 does not inhibit ALDH1A1, ALDH1A2, ALDH1A3, ALDH1B1, or ALDH2 activity. Structural, kinetics, and mutagenesis studies show that CB7 binds to the aldehyde binding pocket of ALDH3A1. ALDH3A1-expressing lung adenocarcinoma and glioblastoma cell lines are sensitized toward mafosfamide (MF) treatment in the presence analogues of CB7, whereas primary lung fibroblasts lacking ALDH3A1 expression, are not.
Introduction
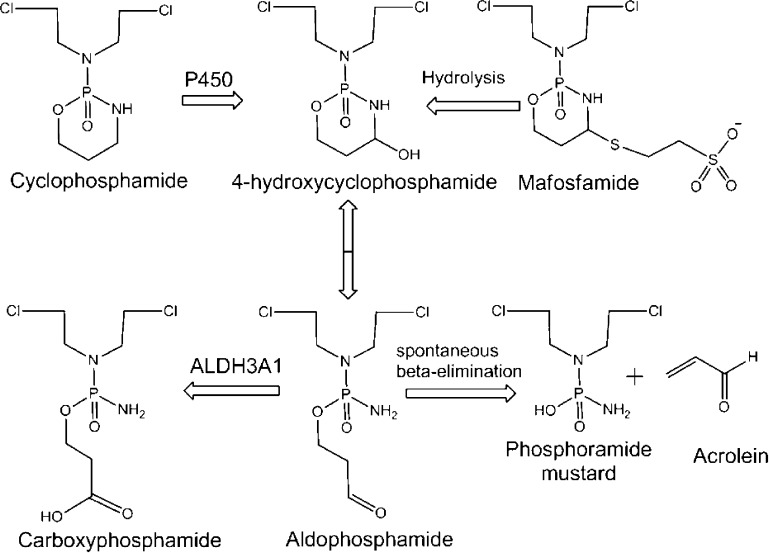
Aldehydes are highly reactive compounds that can form adducts with various cellular nucleophiles. Aldehyde dehydrogenases (ALDH) catalyze the NAD(P)+-dependent oxidation of aldehydes to their corresponding carboxylic acids. The high cellular NAD+/NADH ratio makes the ALDH system an efficient process for eliminating unwanted aldehydes from cells. Out of the 19 functional members of ALDH gene family1 only a few have been characterized structurally, kinetically, and through gene knockout studies. ALDH enzymes are involved in variety of functions some of which include acetaldehyde oxidation (catalyzed by ALDH2), production of retinoic acid (ALDH1A isoforms), folate metabolism (ALDH1L1), metabolism of neurotransmitters (ALDH5A1), as well as proline and branched-chain amino acid metabolism (ALDH4A1 and ALDH6A1, respectively).1 Their function is also emphasized by the fact that single nucleotide polymorphisms (SNPs) leading to loss of enzyme function show serious physiological complications. SNPs associated with the ALDH2*2 allele (E487K or E504K) that is present in the East Asian population are associated with impaired ethanol metabolism2 and reduced efficacy of nitroglycerin.3−5 Interestingly, inhibition of ALDH2 suppresses cocaine seeking behavior in rats6 whereas its activation reduces myocardial infarct size induced by ischemia–reperfusion.7−9 Functional polymorphisms in the ALDH3A2 and ALDH4A1 genes lead to Sjögren–Larson syndrome (SLS)10 and type II hyperprolinemia, respectively.11,12 ALDH isozymes are also involved in cancer progression and chemoresistance. ALDH1A1 is overexpressed in many types of cancer and is considered to be a biomarker of cancer stem cells.13,14 Enzyme kinetics and RNA knockdown studies implicate ALDH isozymes, especially ALDH1A1 and ALDH3A1, in the metabolic inactivation of aldophosphamide to carboxyphosphamide (Figure 1), effectively reducing the efficacy of cyclophosphamide in cancer treatment regimens.15−17
Figure 1.
Metabolism of cyclophosphamide. Cyclophosphamide is oxidized by cytochrome P450 enzymes to 4-hydroxycyclophosphamide and its isomer aldophosphamide. Aldophosphamide can undergo β-elimination to form acrolein and the phosphoramide mustard that alkylates DNA. Alternatively, aldophosphamide can be oxidized to the inactive carboxyphosphamide by ALDH isoenzymes (ALDH1A1 and ALDH3A1). Mafosfamide does not require P450 action for activation and undergoes spontaneous hydrolysis to form 4-hydroxycyclophosphamide.
ALDH3A1 is a cytosolic enzyme most highly expressed in corneal tissues and keratinocytes, where it serves as a crystallin and contributes to the elimination of various UV-induced lipid peroxidation products, such as α,β-hydroxyalkenals and malondialdehyde.18−20 It is not ubiquitously expressed in all cell types, but its expression can be induced by various agents.21 Knockout studies have shown that Aldh3a1(−/−) deficient mice are viable.22 In addition to its expression in some normal cells, ALDH3A1 is also heavily expressed in human tumors such as hepatoma, lung adenocarcinoma, myeloma, breast cancer, and stem cell populations.21,23−26 ALDH3A1 can catalyze the metabolic inactivation of oxazaphosphorines and contribute to drug resistance in various tumor types.26 It is not yet clear whether cancer cells induce ALDH3A1 expression solely to metabolize xenobiotics or its expression is a consequence of changes in the global gene expression pattern in tumorigenic cells. A recent study showed that ALDH3A1 is a downstream target of metadherin (MTDH), an important gene involved in multidrug chemoresistance.27 In that study, fibroblastoid mammary carcinoma (LM2) cells expressing inducible ALDH3A1 shRNA were more sensitive to chemotherapeutic agents such as paclitaxel, doxorubicin, and 4-hydroxycyclophosphamide when ALDH3A1 was down-regulated and chemoresistance to these same agents was increased when ALDH3A1 was overexpressed.27 Differential expression levels of ALDH3A1 account for the variable clinical responses to cyclophosphamide treatment in certain cancers.28 In support of this hypothesis, ALDH3A1 knockdown increases cellular sensitivity to cyclophosphamide15 and transfection of ALDH3A1 into normal human peripheral blood hematopoietic progenitor cells results in increased resistance to cyclophosphamide.29 Previous studies conducted in cultured human colon carcinoma cell lines have shown that the colon C cell line is 10-fold less sensitive to mafosfamide (analogue of cyclophosphamide) than the RCA and HCT 116b colon cancer cell lines, which express 200-fold lower levels of ALDH3A1.24 In contrast, all three cell lines (colon C, RCA, and HCT 116b) were equally sensitive to phosphoramide mustard, the final activated product of cyclophosphamide metabolism that cannot be detoxified by ALDH3A1 (Figure 1).24 The addition of competitive substrates for ALDH3A1 to colon C cancer cells reversed the resistance to mafosfamide,24 while the sensitivity of HCT116b and RCA cells to mafosfamide was unaffected when drug exposure was performed in the presence of the same substrates.24 Another study demonstrated that electroporation of ALDH3A1 into MCF-7 cells reduced their sensitivity to mafosfamide 16-fold relative to control MCF-7 cells.30 Induction of ALDH3A1 in MCF-7 through treatment with catechol yielded cells (MCF-7/CAT) that were more than 35-fold more resistant to mafosfamide compared to control (MCF-7) cells.21 Conversely, treatment of MCF-7/CAT cells with the ALDH3A1 inhibitor chlorpropamide reduced their ED50 for mafosfamide by 10-fold.25 However, the chlorpropamide class of compounds is not selective for ALDH3A1 and also inhibits ALDH2.31 More recently, a nonselective mechanism-based inhibitor of ALDH isoenzymes enhanced sensitivity toward mafosfamide in A549 cells.32 However, the nonselective nature of these compounds makes it difficult to determine the individual contributions of each ALDH isozyme to the sensitization.
Isozyme selective inhibitors for ALDH isozymes are few, especially for ALDH3A1. Selective small molecule inhibitors of ALDH3A1 could enhance the sensitivity of chemotherapeutic agents such as cyclophosphamide analogues as well as tease out the contributions to aldophosphamide metabolism in tumor cells. Some antineoplastic agents induce apoptosis in cancer cells by producing oxidative stress through generation of lipid peroxidation products. Since ALDH3A1 can detoxify the products of lipid peroxidation, it can facilitate drug resistance in cancer cells that show high ALDH3A1 expression. Therefore, selective small molecule inhibitors of ALDH3A1 can be helpful in overcoming these effects. Here, we report kinetic, structural, and cellular characterization of a highly selective inhibitor for ALDH3A1, designated CB7, previously identified in our high throughput screen.33 When tested at concentrations up to 250 μM, CB7 showed no inhibition of ALDH1A1, ALDH1A2, ALDH1A3, ALDH1B1, or ALDH2 activity. Enzyme kinetics and crystallographic studies indicate that this compound is competitive with respect to aldehyde binding and noncompetitive with respect to NADP+ binding. Treatment of the ALDH3A1 expressing cell lines A549 (lung adenocarcinoma) and SF767 (glioblastoma) with mafosfamide in combination with 10 μM CB7, or analogues of CB7, enhanced the antiproliferative effects of mafosfamide, whereas treatment of primary lung fibroblasts (CCD-13Lu), which do not express ALDH3A1, did not.
Results
Kinetic Characterization of CB7
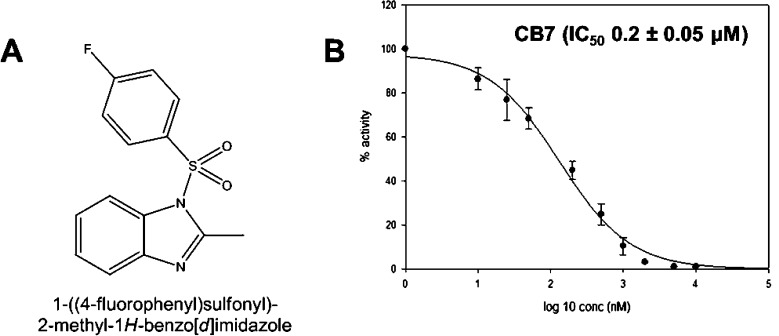
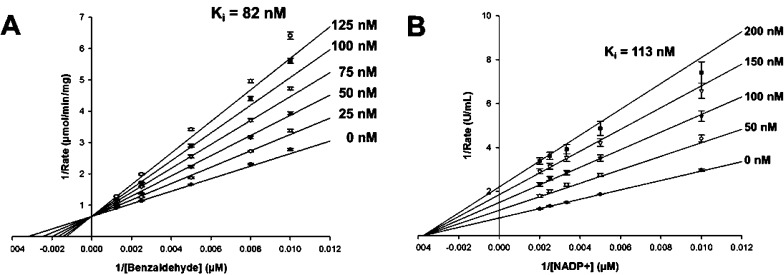
CB7 emerged from our original high-throughput screen as a selective inhibitor of ALDH3A133 (Figure 2A). CB7 has a molecular mass of 290 Da and has no structural similarity to any known inhibitors of aldehyde dehydrogenases. The compound has good potency (IC50 of 0.2 ± 0.05 μM) for an initial hit compound against ALDH3A1 (Figure 2B) and good selectivity with no effect on ALDH1A1, ALDH1A2, ALDH1A3, ALDH1B1, or ALDH2 activity up to 250 μM. CB7 exhibits a competitive mode of inhibition with respect to varied benzaldehyde, with a Ki of 82 ± 6 nM, and a noncompetitive mode of inhibition with respect to varied NADP+, with a Ki of 110 ± 3 nM (Figure 3A and Figure 3B).
Figure 2.
(A) Chemical structure of CB7. (B) IC50 plot for CB7 with respect to ALDH3A1 catalyzed benzaldehyde oxidation.
Figure 3.
Mode of inhibition of CB7 toward ALDH3A1. (A) Lineweaver–Burk representation of the nonlinear fit to the competitive inhibition equation for CB7 (0–125 nM) versus varied benzaldehyde (100–1000 μM) at fixed coenzyme concentration NADP+ (1.5 mM). (B) Lineweaver–Burk representation of the nonlinear fit to the noncompetitive inhibition equation for CB7 (0–200 nM) toward varied NADP+ (100–500 μM) at fixed benzaldehyde (1 mM). All experiments were performed in triplicate, and one representative experiment out of three is depicted.
Structure–Activity Relationship of CB7 Derivatives on ALDH3A1
We initiated a search for structural analogues of CB7 in order to develop structure–activity relationships (SARs) for this class of compound. We identified 118 different compounds that exhibited at least 90% structural similarity to CB7. These compounds were tested for their potency toward ALDH3A1 and selectivity versus ALDH1 and ALDH2 isoenzymes. Our initial kinetics study showed that the central sulfonyl group substituted with a benzimidazole and benzene ring were essential elements of CB7. Hence, we defined these three moieties as a core structure and looked for analogues with substitutions from this core (Table 1). Our SAR showed that a methyl group at the R1 position is optimal (compare A20 with A21, and A10 with A3, Table 1), and larger substitutions were not tolerated (compare A6 and A13 with A20, A21, B36, and B37, Table 1). No substitutions were tolerated at the R2 and R3 positions (A38 and A47). We suggest that other than small halogens, which were not available for testing, substitutions at the R2 and R3 positions are incompatible with inhibition of ALDH3A1. We looked at analogues with different chemical substituents at the R6 position. Analogues with hydrogen, methyl, isobutyl, and acetamide substitutions at this position do not inhibit ALDH3A1; only compounds with fluorine or chlorine at the R6 position were inhibitors (compare A5, A3, A16, and A67 with A21 and A24, Table 1). Substitutions at the ortho (R4 or R8 position) were also detrimental to potency (A30 versus A20, or A39 versus A24 or A40 with CB7). Although substitution at the meta position (either R5 or R7) was tolerated, they decreased inhibitory potency (A53 and A64 versus A20 or A70 versus CB7). In summary, no available analogues exceeded the potency of the original hit molecule, CB7. Importantly, none of the analogues inhibited ALDH1A2, ALDH1A3, or ALDH1B1 at concentrations up to 100 μM. As a consequence, with inhibition constants of ∼100 nM and with no inhibitory effect on the ALDH1 (ALDH1A1, ALDH1A2, ALDH1A3, ALDH1B1) or ALDH2 isoenzymes, CB7 is an excellent lead compound for the development of focused library synthesis.
Table 1. Structure–Activity Relationships for Analogues of CB7a.
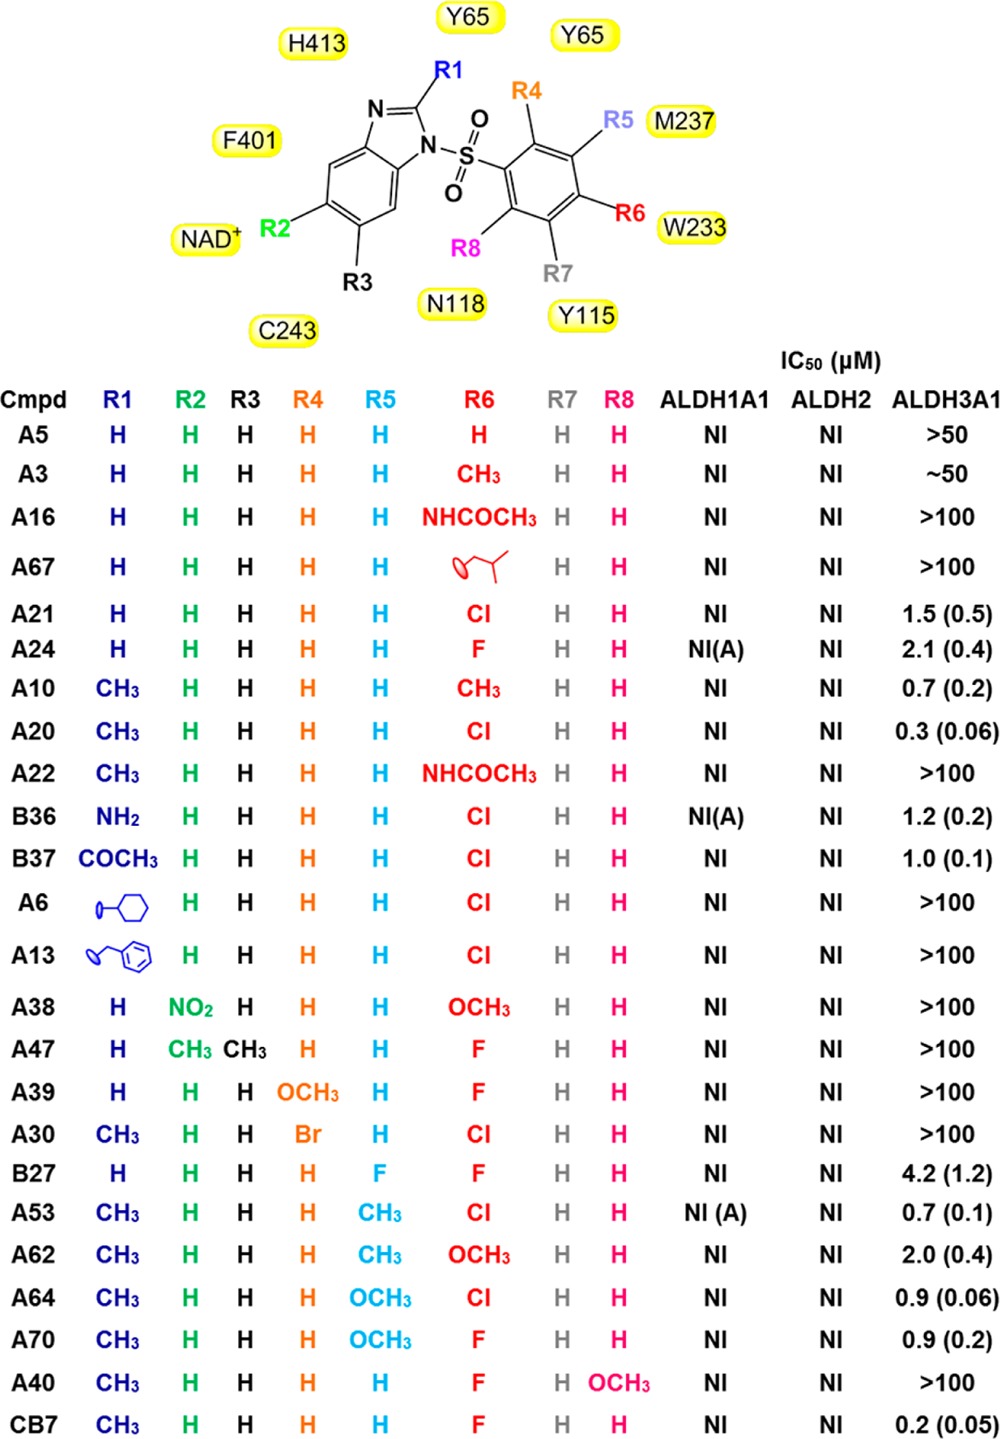
Values in parentheses represent standard error. NI stands for no inhibition, and NI(A) stands for no inhibition but very weak activation (∼20% at 100 μM). Residues of ALDH3A1 that are in close contact with CB7 are shown in yellow boxes. None of the compounds tested had any inhibitory effect on ALDH1A2, ALDH1A3, or ALDH1B1. Figure was generated using ChemBioDraw Ultra 12.0.
ALDH3A1 Crystal Structure with CB7 and NAD+
1. CB7 Interaction with ALDH3A1
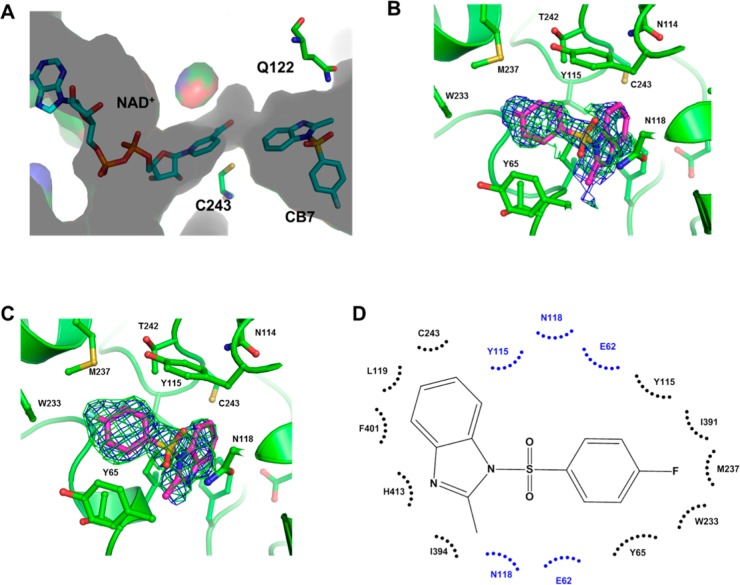
To complement our kinetics experiments and further our understanding of the SAR results, we solved the crystal structure of CB7 bound to ALDH3A1. Since the inhibition pattern was competitive with respect to varied benzaldehyde and noncompetitive with respect to varied coenzyme, we cocrystallized ALDH3A1 in the presence of both NAD+ and CB7. The complex formed as monoclinic crystals and diffracted to 1.9 Å resolution. The structure was determined by molecular replacement using the apo ALDH3A1 structure as the search model (PDB code 3SZA). The asymmetric unit contains two independent dimers. Each subunit contains a well-ordered NAD+ bound to the coenzyme binding site of ALDH3A1 (Figure 4A and Figure 5A). In contrast, CB7, while present in each active site, is modeled as half-occupied in each of the four subunits such that its refined B-factors match those of the surrounding amino acid side chains that contact CB7 (Figure 4B and 4C). Detailed refinement statistics are provided in Table 2. In the Ramachandran plot, 97.3% of all residues are in the most favored regions. Perhaps underlying the less well-defined electron density is the fact that no hydrogen bonding interactions were observed between CB7 and ALDH3A1; rather, it would appear that extensive van der Waals and hydrophobic interactions drive the association (Figure 4D), which may lead to multiple binding modes, for which there is weak difference density evidence surrounding the modeled position of CB7 in each subunit. However, modeling of these alternative binding modes does not improve the refined model structure and has not been included in the final set of deposited coordinates. The common binding mode for CB7 in the four active sites shows that the benzimidazole moiety forms hydrophobic contacts with Phe401, Tyr115, Leu119, Cys243, His413, and Ile394. The methyl group associated with imidazole ring forms hydrophobic interaction with Tyr65 and Ile394. One of the sulfonyl oxygen atoms forms van der Waals interactions with Tyr65, Glu62, and Asn118, while the other sulfonyl oxygen forms van der Waals interactions with Tyr115, Glu62, and Asn118. The fluorobenzene group forms hydrophobic interactions with Tyr65 and Tyr115, as well as with Thr395 and Glu61. The fluorine atom forms van der Waals contacts with Ile391, Trp233, and Met237 (Figure 4D). These structural data were essential for understanding our SAR data. Our SAR study showed that analogues with hydrogen, methyl, isobutyl, acetamide substitution at R6 position do not inhibit ALDH3A1 whereas fluorine or chlorine substitution was able to inhibit ALDH3A1 (compare A5, A3, A16, and A67 with A21 and A24, Table 1). Since chlorine and fluorine are both small and electron withdrawing atoms, we believe that these substituents not only enhance the hydrophobic interactions with Tyr65 and Tyr115 but also do not add sufficient bulk to comprise the van der Waals interactions with Trp233 (A20 versus A22, Table 1).
Figure 4.
Binding of CB7 to the active site of ALDH3A1 (PDB code 4L2O). (A) Surface representation of catalytic and NAD(P)+ binding site of ALDH3A1. NAD+ is bound into the Rossmann fold, whereas CB7 binds into the catalytic pocket. Bound ligands are represented as sticks. (B) Original σA-weighted electron density map prior to inclusion of CB7 in the model for refinement contoured at 2.5 standard deviations (Fo – Fc, green) at 1 standard deviation (2Fo – Fc, blue) superimposed onto the final refined model of CB7 bound in the enzyme active site. Residues that contribute to hydrophobic interactions within a distance of 3.4–4.0 Å are represented as sticks. (C) Simulated annealing omit electron density map calculated by the program PHENIX53 displaying the residual electron density (Fo – Fc, green, contoured at 2.5 standard deviations of the map and 2Fo – Fc, blue contoured at 1 standard deviation of the map) present in the active site of the ALDH3A1 structure superimposed onto the final refined model of CB7 bound in the enzyme active site. (D) Two dimensional schematic representing hydrophobic (black arcs) and van der Waals contacts (blue arcs) seen between CB7 and residues within the active site of ALDH3A1.
Figure 5.
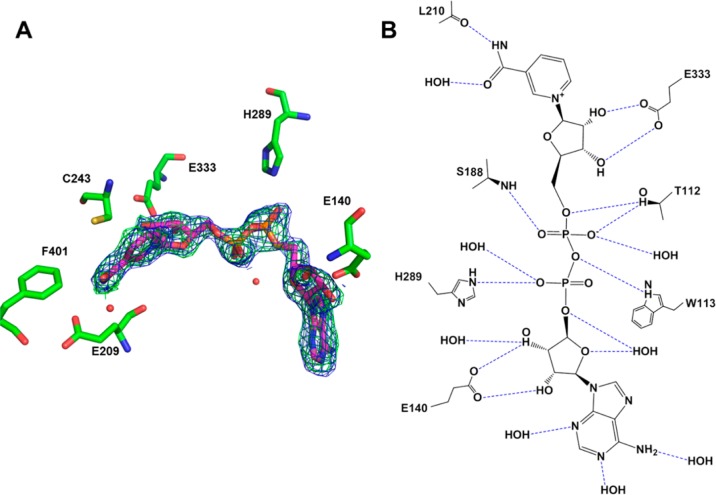
Binding of NAD+ to ALDH3A1 (PDB code 4L2O). (A) Cofactor binding site of ALDH3A1 with NAD+ bound. The electron density maps displayed are the original σA-weighted Fo – Fc map contoured at 2.5 standard deviations (green) and the original σA-weighted 2Fo – Fc map contoured at 1 standard deviation (blue) superimposed on the final refined model of NAD+ bound in the enzyme active site. Selected residues involved in strong hydrogen bonding interactions and hydrophobic interactions are shown. (B) Two-dimensional map showing all the hydrogen bonds between NAD+ and ALDH3A1. Hydrogen bonds with a distance of <3.2 Å are shown by blue dotted lines.
Table 2. X-ray Data Collection and Refinement Statistics for ALDH3A1 Bound to CB7.
| data collection | ALDH3A1 (CB7 cocrystal) |
|---|---|
| space group | P21 |
| cell dimensions | |
| a (Å) | 95.2 |
| b (Å) | 90.9 |
| c (Å) | 117.9 |
| β (deg) | 112.4 |
| resolution (Å) | 108.96–1.95 |
| Rmerge | 0.072 (0.35) |
| I/σI | 10.9 (4.5) |
| completeness (%) | 96.3 |
| redundancy | 2.8 |
| Refinement | |
| resolution (Å) | 108.96–1.95 |
| no. of reflections | 125475 |
| Rwork/Rfree | 0.21/0.25 |
| no. of atoms | |
| protein | 14073 |
| ligand/ion | 267 |
| water | 979 |
| average B-factors | |
| protein | 30.4 |
| coenzyme | 33.9 |
| ligand (CB7) | 34.2 |
| water | 33.6 |
| rmsd bond (deg) | 1.07 |
| rmsd bond length (Å) | 0.005 |
2. NAD+ and Its Interaction with ALDH3A1
ALDH3A1 is relatively unique among the human ALDH family members in that it is capable of utilizing either NAD+ or NADP+ as coenzyme. Only one other structure of ALDH3A1 has coenzyme bound,34 but the nicotinamide ring is observed in a nonproductive syn conformation. The structure of human ALDH3A1 with bound NAD+ reported here is similar to other ALDH family members in that the nicotinamide ring is held near the catalytic cysteine (Cys243 in ALDH3A1) in the anti conformation and is positioned in the hydride-transfer conformation.35 In stark contrast to the interactions between CB7 and ALDH3A1, many hydrogen bonding interactions are observed between NAD+ and ALDH3A1. The amino nitrogen from the nicotinamide moiety forms a hydrogen bond with peptide carbonyl oxygen from Leu210, while the nicotinamide carbonyl oxygen hydrogen-bonds with a water molecule that is hydrogen-bonded to Thr186 and Tyr412. The two hydroxyl groups from the nicotinamide ribose form two hydrogen bonds with the side chain carboxylate oxygens of Glu333, as well as to a water molecule. The pyrophosphate group forms five hydrogen bonds with Thr112, Ser188, Trp113, and His289, as well as an additional four hydrogen bonds with ordered water molecules. The 2′ and 3′ hydroxyls from the adenosine ribose moiety form two hydrogen bonds with the side chain of Glu140, as well as four hydrogen bonds to ordered water molecules. These latter interactions are likely modified when the 2′-hydroxyl is phosphorylated, as would be in NADP+. Hydrophobic interactions are contributed by Val169, Val191, Ile194, and Thr172 to position the adenine ring, and the nicotinamide ring is stabilized by hydrophobic and van der Waals interactions with Thr186, Asn114, Cys243, Phe401, Leu361, Thr112, Leu119, and Glu209 (Figure 5B).
Characterization of Q122A and Q122W Mutants
We compared the crystal structure of human ALDH3A1 against human ALDH2 (PDB code 1CW3) and sheep ALDH1A1 (PDB code 1BXS) to compare their active sites (Figure 9). Upon structural alignment, we identified a critical tryptophan (W177) that is present in both sheep ALDH1A1 and ALDH2 active site but not in ALDH3A1, which could explain the selectivity of CB7 for ALDH3A1. In the ALDH3A1 active site, a glutamine (Q122) residue is present in the corresponding position (Figure 9). A sequence alignment of human and sheep ALDH1A1 confirmed that this tryptophan residue is conserved in the human enzyme and is highly conserved across all human ALDH isoenzymes (Figures S1 and S2). In order to investigate the impact of glutamine/tryptophan at this position toward CB7 binding in ALDH3A1, we mutated the glutamine to either alanine or tryptophan. Kinetic parameters were determined for benzaldehyde oxidation for the wild-type and mutant ALDH3A1 enzymes (Table 3). We also determined the inhibition constants for CB7 on these mutants (Table 3). The alanine mutation did not show a drastic effect on the enzyme’s catalytic efficiency toward benzaldehyde or its ability to bind CB7 (Table 3). However, when Gln122 was mutated to tryptophan (Q122W), CB7 was not inhibitory up to 250 μM for this mutant. In contrast, the mutant enzyme’s catalytic efficiency toward benzaldehyde was only decreased 3-fold compared to the wild-type enzyme. These data support the hypothesis that the structure of the substrate-binding site surrounding Q122 is responsible for imparting selectivity toward CB7.
Figure 9.
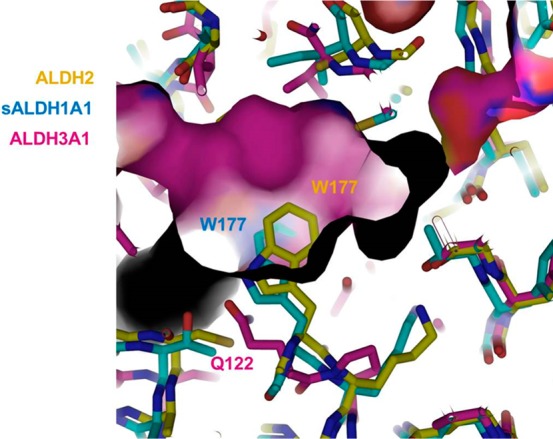
Structural superimposition of the active sites of human ALDH2 (PDB code 1CW3) and sheep ALDH1A1 (PDB code 1BXS) and human ALDH3A1 (PDB code 3SZA). The molecular surface for ALDH3A1 is displayed using atom-type coloring (carbon, magenta; nitrogen, blue; oxygen, red; sulfur, yellow). The structures of sheep ALDH1A1 (carbon, cyan) and human ALDH2 (carbon, yellow) were represented using alternative atom-type coloring.
Table 3. Kinetics Data for ALDH3A1 and the Q122A and Q122W Mutant Enzymes.
| KMbenzaldehyde (μM) | kcat/KM (min–1 μM–1) | KiCB7 (μM) | |
|---|---|---|---|
| WT | 279 ± 23 | 4.91 ± 0.25 | 0.2 |
| Q122A | 425 ± 38 | 3.2 ± 0.13 | 0.2 |
| Q122W | 257 ± 35 | 1.73 ± 0.27 | NI |
CB7 and Its Analogues Show Inhibition of Dehydrogenase Activity in Cell Lysates
Lysates from series of cell lines were analyzed for the levels of ALDH3A1 and ALDH1A1 protein expression, since these two enzymes are known to contribute to cyclophosphamide metabolism. Three cell lines were chosen as representatives of transformed and nontransformed cells with differential ALDH isozymes expression: A549, SF767, and CCD-13Lu. Our Western blot analysis confirmed that the A549 cell line (lung adenocarcinoma) expresses both ALDH1A1 and ALDH3A1.36 The SF767 cell line (glioblastoma) expresses only ALDH3A1,36 and the primary human lung fibroblasts (CCD-13Lu) showed no detectable expression of either ALDH3A1 or ALDH1A1.36 In fact, the antibody chosen for the ALDH1A1 Western blot cross-reacts with ALDH1A2, ALDH1A3, ALDH1B1, and ALDH2,36 so the SF767 cell line appears to be devoid of most class 1 and class 2 ALDH expression. To examine the ability of CB7 and selected analogues to function in a complex milieu, we tested their ability to inhibit ALDH activity in cell lysates using benzaldehyde and NADP+ as ALDH3A1 selective substrates. Benzaldehyde is a substrate for both ALDH1A1 and ALDH3A1, but ALDH1A1 does not use NADP+ as a coenzyme; thus, this assay measures primarily ALDH3A1 activity. Consistent with our immunoblot experiments, A549 cells showed robust ALDH3A1 activity (282 nmol min–1 mg–1), which was equivalent to approximately 1% of the cellular protein. SF767 cells also showed robust ALDH3A1 expression (1% of the total protein), whereas CCD-13Lu had no ALDH3A1 activity (<2 nmol min–1 mg–1) consistent with our immunoblot studies.36 The presence of CB7 and selected analogues at 10 μM decreased the measurable activity in A549 cell lysates by >97% and in SF767 cell lysates by >93% (Figure 6). For comparison, the activity of purified recombinant ALDH3A1 was decreased by more than 98% by the same 10 μM concentration of CB7 and CB7 analogues (Figure 6). These data suggest that CB7 and its analogues can target ALDH3A1 activity in the context of cellular lysates with potencies similar to those observed in purified enzyme preparations.
Figure 6.
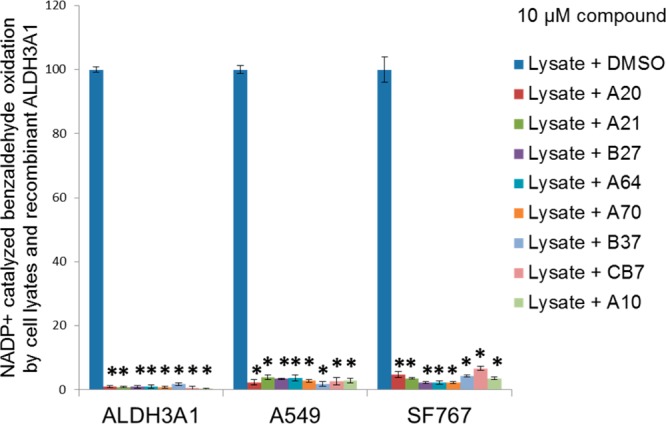
Activity of ALDH3A1 in cell lysates. A549, SF767, and CCD-13Lu cell lysate activity as well as recombinant ALDH3A1 activity was tested in the presence of 1.5 mM NADP+ and 1 mM benzaldehyde and in the presence and absence of 10 μM CB7 and its analogues. CCD-13Lu did not show any NADP+ catalyzed benzaldehyde oxidation. The p-values were calculated using the Student’s t test comparing activity in the absence and presence of ALDH3A1 inhibitor (∗, p < 0.0001, n = 3).
Sensitization of Tumor Cells to Mafosfamide through Inhibition of ALDH3A1
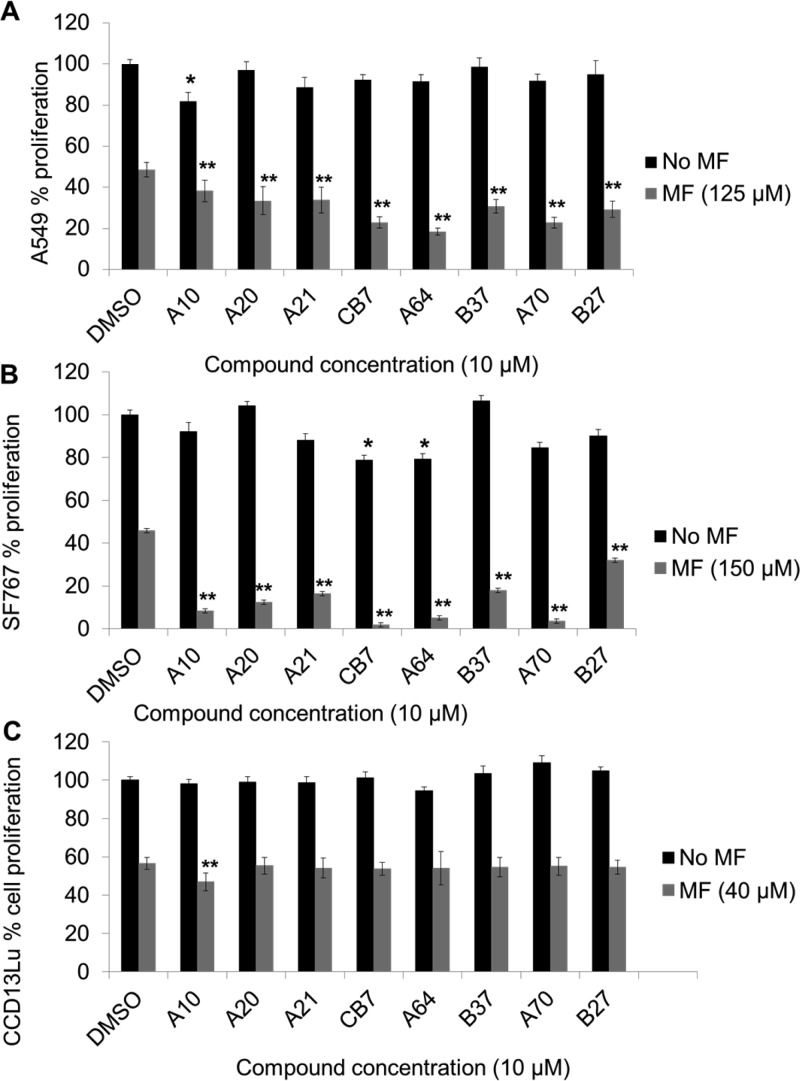
Prior work had demonstrated that the level of ALDH activity in tumor cells is correlated with the level of resistance toward cyclophosphamide or its derivatives.23,24,26,28 However, the extent to which ALDH3A1 contributes to this resistance has been the subject of some debate15,21,24,37−39 even though RNA knockdown of both ALDH1A1 and ALDH3A1 was required for maximal sensitization of A549 cells toward aldophosphamide.15 Since our new ALDH3A1 inhibitors demonstrated both good potency and selectivity, we initiated studies designed to test whether inhibition of ALDH3A1 alone could sensitize cells toward cyclophosphamide derivative. For these studies, we used mafosfamide, since this compound spontaneously generates aldophosphamide in solution without the need for P450 activation. Treatment of A549, CCD-13Lu, and SF767 cells with mafosfamide decreased cell proliferation of all three cell lines (parts A, B, and C of Figure 7, DMSO control vs mafosfamide, 48 ± 3% (A549), P < 0.0001; 46 ± 2% (SF767), p < 0.0001; 56 ± 3% (CCD-13Lu), p < 0.0001). Except for analogue A10, treatment of A549 cells with CB7 analogues alone at 10 μM had no significant effect on cell proliferation. However, when A549 cells were treated with mafosfamide in the presence of 10 μM ALDH3A1 inhibitor, we observed additional decreases in cell proliferation. A549 cells demonstrated a dramatic decrease in cellular proliferation when mafosfamide was used in combination with analogues CB7 (2.3-fold, p < 0.005), A64 (2.7-fold, p < 0.005), and A70 (2.4-fold, p < 0.005) (Figure 7A). Similar experiments on SF767 cells showed significantly increased chemosensitivity with analogues A10, A20, A21, CB7, A64, A70, and B37. Analogues CB7, A64, and A70 were the most potent analogues in A549 cells and in SF767 cells, suggesting effective inhibition of ALDH3A1. Although we see some effect on SF767 cells by CB7 (1.25-fold, p < 0.05) and A64 (1.2-fold, p < 0.05) as single agents (Figure 7B), in proliferation-based experiments, effects of these compounds along with mafosfamide were much more dramatic (Figure 7B, MF 46 ± 2% vs MF + ALDH3A1 inhibitor 2 ± 1% (CB7), P < 0.005; 6 ± 1% (A64), P < 0.005; 3 ± 1% (A70), P < 0.005)). This effect was also cell line specific, since we did not see this pattern in A549 and CCD-13Lu cells.
Figure 7.
Effect of CB7 and analogues on cell proliferation. A549 (A), SF767 (B), and CCD-13Lu (C) cells were treated with mafosfamide concentration that corresponded to their ED50 values. Treatment was done in the presence and absence of ALDH3A1 inhibitors (10 μM). MTT assay was used to determine cell proliferation. Vehicle (DMSO) concentration was limited to 0.25% (v/v). The p-values were calculated by comparing the cellular proliferation of DMSO treated cells versus inhibitor treated cells (∗, p < 0.05, n = 15) or mafosfamide (MF) treated cells versus MF + 10 μM ALDH3A1 inhibitor treated cells (∗∗, p < 0.005, n = 15). Black bars represent compound treatment alone, and gray bars represent compound and mafosfamide treatment, mean value ± SE.
In the case of CCD-13Lu cells, increased chemosensitization was not observed with CB7 analogues. However, analogue A10 decreased cell proliferation (1.1-fold, p < 0.05) when these cells were treated with 10 μM ALDH3A1 inhibitor along with mafosfamide (Figure 7C). SF767 cells were more sensitive to mafosfamide as measured by MTT assay when treated with ALDH3A1 inhibitors than were A549 cells (compare Figure 7A and 7B), which is consistent with more than one active ALDH isozyme present in A549 cells. To confirm targeted binding, we determined the dose dependency for three compounds in A549 and SF767 cells (Figure 8A). We observed a dose-dependent decrease in cell proliferation in both A549 and SF767 cell lines, albeit more pronounced in SF767 cells which express predominantly ALDH3A1. To calculate the shift in ED50 value of mafosfamide in the presence of ALDH3A1 inhibitors, we treated SF767 cells with increasing amounts of mafosfamide in the presence or absence of CB7, A64, and A70 at 10 μM. Results showed that in the presence of ALDH3A1 inhibitors, ED50 values of mafosfamide drop significantly: 1.5-fold for CB7, 1.9-fold for A64, and 2-fold for A70 (ED50 values: 146 ± 2 μM (MF) vs 96 ± 6 μM (MF + CB7), 75 ± 5 μM (MF + A64), 74 ± 4 μM (MF + A70)) (Figure 8B). The consequence of this increased sensitivity is that SF767 cell proliferation decreases from 50% with mafosfamide alone (150 μM) to less than 10% when ALDH3A1 is selectively inhibited in combination with mafosfamide treatment.
Figure 8.
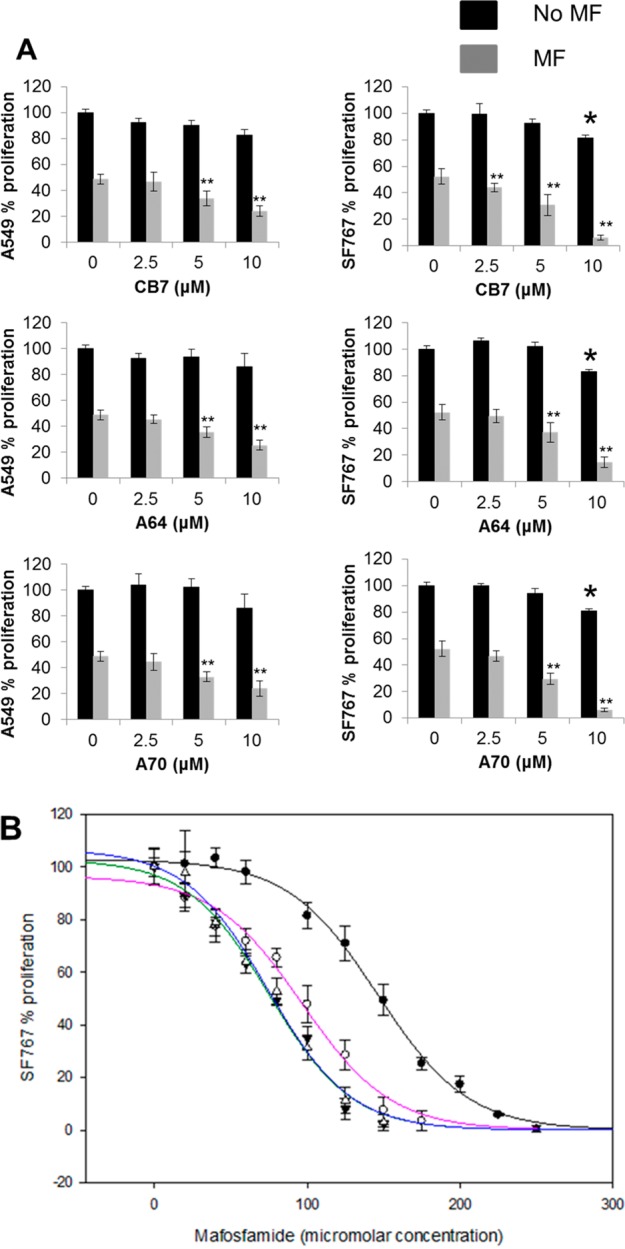
Dose response of CB7, A64, and A70 for mafosfamide sensitization. (A) A549 and SF767 were treated with MF (ED50 concentration) with increasing concentration of analogues CB7, A64, and A70. The p-values were calculated by comparing the cellular proliferation of DMSO treated cells versus inhibitor treated cells (∗, p < 0.05, n = 15) or MF treated cells versus MF + ALDH3A1 inhibitor treated cells (∗∗, p < 0.005, n = 15). Black bars represent ALDH3A1 inhibitor treatment alone, and gray bars represent ALDH3A1 inhibitor plus MF treatment, mean value ± SE. (B) SF767 cells were treated with CB7, A64, and A70 at 10 μM with increasing concentration of MF. Cell proliferation was determined using MTT assay, and plot for percent (%) proliferation was created using the SigmaPlot (version 11, StatSys). Shaded circles (●) show SF767 cell proliferation treated with mafosfamide in the absence of inhibitors. Open circles (○), inverted shaded triangles (▼), and open triangles (△) show cell proliferation with MF in the presence of inhibitors CB7, A64, and A70, respectively. The solid trend lines (MF + DMSO (black), MF + CB7 (pink), MF + A64 (green), MF + A70 (blue)) represent the fits to the three-parameter logistics equation. DMSO concentration was limited to 0.25% (v/v) (n = 15). Figures were generated using SigmaPlot, version 11.0.
Discussion and Conclusion
Cyclophosphamide is one of the most successful and widely utilized antineoplastic agents. In addition to its antineoplastic property, it is also a potent immunosuppressant and is used during bone marrow transplantation. Varied cellular expression of aldehyde dehydrogenase has an adverse effect in anticancer therapeutics and immunosuppressive properties of cyclophosphamide. Cyclophosphamide is activated by cytochrome P450 enzymes to the intermediate 4-hydroxycyclophosphamide (Figure 1). 4-Hydroxycyclophosphamide undergoes spontaneous isomerization to form aldophosphamide. Aldophosphamide can undergo β-elimination to form acrolein and phosphoramide mustard (Figure 1), the latter of which forms double-stranded DNA cross-links and stalls replication. Alternatively, aldophosphamide can be metabolized by aldehyde dehydrogenase isozymes to the less toxic carboxyphosphamide metabolite (Figure 1). As a consequence of their ability to metabolically inactivate aldophosphamide, ALDH isozymes (especially ALDH1A1 and ALDH3A1) are known for their ability to induce resistance toward derivatives of cyclophosphamide.15,17,24,26,28 To overcome this resistance, increased levels of cyclophosphamide are required, but these higher concentrations lead to severe side effects such as anemia, leukopenia, and neutropenia due to bone marrow toxicity.17 Other effects include cardiac toxicity,40 gonadal failure,41 bladder toxicity,42 and complications such as peripheral neuropathy.43 Therefore, selective inhibition of the active metabolic pathways present in specific tumors that lead to the inactivation of cyclophosphamide may permit lower effective dosages and potentially reduce the unwanted side effects.
Prior work showed that nonselective inhibition of aldehyde dehydrogenase can sensitize A549 cells to the cytotoxic effects of mafosfamide.32 Other in vitro and cell-based work demonstrated that both ALDH1A1 and ALDH3A1 contribute to aldophosphamide metabolism, although the contributions of ALDH1A1 is thought to be higher than that of ALDH3A1.39 This is also consistent with RNAi knockdown studies where reductions in both ALDH1A1 and ALDH3A1 were required for maximal sensitivity to aldophosphamide.15 Identification of cell permeable selective inhibitors for ALDH3A1 and ALDH1A1 isozymes may therefore help us understand their individual contributions toward aldophosphamide metabolism and could lead to targeted therapies for increasing chemoresistance in selected tumors with specific ALDH isozyme expression.
In our study, we have identified and characterized a selective inhibitor of ALDH3A1 having submicromolar potency, CB7. Kinetics analysis showed that our inhibitor is competitive with respect to aldehyde substrates and noncompetitive with respect to cofactor binding. This is further supported by the crystallographic results that show binding within the aldehyde substrate-binding site. Surprisingly, SAR studies on analogues of CB7 showed that our original hit compound, CB7, was the most potent analogue available. We used the structural information available from CB7·ALDH3A1·NAD+ crystal structure to further illuminate the SAR on this class of compound. The proximity of the benzyl substituent of the benzimidazole moiety to Cys243, Phe401, Leu119, and Tyr115 explains the detrimental effects of adding substituents to the R2 and R3 positions (Table 1 and Figure 4). Moreover, the nicotinamide carbonyl oxygen is 3.9 Å from the benzimidazole ring such that a methyl group at the R2 position would create steric overlap with this portion of the NAD+ molecule. In addition, the side chain of Tyr65 limits substitutions at the R1 and R4/R8 positions (Table 1, Figure 4C, and 4D). Similarly, the side chain of Tyr115 impacts the available space surrounding the ortho R4/R8 positions. On the other hand, substitutions at the R5 and R6 positions are tolerated because of the small cavity between Trp233 and Tyr65. Our SAR study suggests that smaller substitutions, preferably electron withdrawing halogens, were optimal at the R6 position because of the presence of Trp233 and Met237 at distances of 4 and 3.5 Å from the R6 position, respectively. Overall, our SAR supports the structural data presented here and interpretation of the SAR based on this structure is fully consistent with CB7 being the most potent compound of the series. We also identified Gln122 as a major contributor to the internal topology of ALDH3A1 that accounts for selectivity of CB7 for ALDH3A1 versus ALDH1A1 or ALDH2. In particular, a sequence alignment of all human ALDH protein sequences (Figure S2) demonstrates that a Trp residue at the position equivalent to W177 in ALDH2 and ALDH1A1 is present in 12 of the 19 human open-reading frames. Only ALDH3A1, ALDH3A2, and ALDH18A1 have Gln at this position, while ALDH3B1, ALDH3B2, and ALDH4A1 have smaller hydrophobic residues and ALDH5A1 has an Arg at this position. Consequently, selectivity of CB7 toward all human ALDH isoenzymes is likely to be high and may only adversely impact ALDH3A2 and ALDH18A1, the latter of which is not yet known to be active and lacks key active site residues in sequence alignments.
Several ALDH3A1 inhibitors reported here enhance the antiproliferative effects of mafosfamide but had little if any effects on cellular proliferation at the doses tested in our assays. Presumably, this effect is mediated by their ability to inhibit the metabolism of mafosfamide by ALDH3A1. In particular, SF767 cells used in this work express only ALDH3A1 and demonstrated the greatest level of chemosensitization. However, even A549 cells, which express both ALDH1A1 and ALDH3A1, could be sensitized by these same compounds. ALDH3A1 is not the only means by which mafosfamide can be inactivated, and this is demonstrated by the partial sensitization observed in A549 cells, relative to the same treatments in SF767 cells. In contrast, these same compounds show neither general toxicity nor enhancement of chemosensitivity in primary human lung fibroblasts (CCD-13Lu), which do not express either ALDH1A1 or ALDH3A1. High levels of ALDH expression in both SF767 and A549 cells (about 1% of total soluble protein) compared to the undetectable expression in normal human lung fibroblasts also point to the involvement of these ALDH isoforms as markers of transformed cells. Whether the general expression of ALDH isozymes is required for the maintenance of the transformed phenotype or simply a consequence of a change in global gene expression is less clear. However, the involvement of ALDH isoforms in mafosfamide resistance is supported by several lines of evidence.23,24,26,28 Certainly, the correlation between ALDH expression and sensitivity toward mafosfamide can be seen in the fact that human lung fibroblasts (CCD-13Lu) have the lowest ED50 value for mafosfamide at 40 μM, whereas A549 and SF767 tumor cell lines were considerably more resistant with ED50 values of 125 and 146 μM, respectively, for mafosfamide. ALDH3A1 can be a major contributor to mafosfamide metabolism as observed in SF767 glioblastoma cell line. The presence of CB7, A64, or A70 at 10 μM lowers the ED50 for mafosfamide to 96 ± 6, 75 ± 5, or 74 ± 4 μM, respectively (Figure 8B). In fact, the simultaneous presence of an ALDH3A1 inhibitor and 150 μM mafosfamide reduces cell proliferation to less than 5% of control. Consequently, selective inhibition of ALDH3A1 can provide a means to enhance the antiproliferative effects of mafosfamide in selected tumor types and perhaps permit therapies to proceed with reduced marrow toxicity.
Experimental Section
Materials
Reagents such as benzaldehyde, propionaldehyde, p-nitrophenyl acetate, NAD+, NADP+, and buffers were all purchased from Sigma Aldrich unless otherwise stated. PEG3350 for crystallization trial was purchased from Hampton Research.
Cell Lines
A549, CCD-13Lu, and SF767 cell lines were provided by Dr. Hua Lu, ATCC, and Dr. Karen Pollok, respectively. A549 and CCD-13Lu cells were cultured in DMEM (Cellgro, Mediatech Inc., Manassa, VA) supplemented with 10% fetal bovine serum (FBS) (Gibco, Invitrogen Company, Grand Island, NY), 100 units/mL penicillin, and 10 μg/mL streptomycin. SF767 cell lines were cultured in IMDM (Gibco, Invitrogen Company, Grand Island, NY) supplemented with 10% fetal bovine serum (FBS) (Gibco, Invitrogen Company, Grand Island, NY), 100 units/mL penicillin, and 10 μg/mL streptomycin. Cell viability as assessed by tryphan blue exclusion was consistently >95%. Cells were passaged after reaching 80–90% confluence, which usually took 3–4 days for A549 and SF767 cell lines and 8–12 days for CCD-13Lu cells.
Protein Expression and Activity Measurement
Human ALDH1A1, ALDH2, and ALDH3A1 were expressed and purified as described elsewhere.32,33,44 Human ALDH1A2, ALDH1A3, and ALDH1B1 were expressed and purified as described elsewhere.36 The enzymatic activities of ALDH1A1, ALDH2, and ALDH3A1 were monitored by calculating the increase in absorbance at 340 nm due to NAD(P)H formation (molar extinction coefficient of 6220 M–1 cm–1) as described earlier.33,44 The activities of ALDH1A2, ALDH1A3, and ALDH1B1 were monitored as described elsewhere.36 The specific activities of the purified proteins were 1.9, 0.80, 0.44, 0.20, 3.8, and 32 μmol min–1 mg–1 for ALDH1A1, ALDH1A2, ALDH1A3, ALDH1B1, ALDH2, and ALDH3A1 respectively.
Inhibitors
CB7, the most potent and selective ALDH3A1 inhibitor discovered in our initial chemical screen,33 was purchased from ChemBridge Corp. This compound had three important moieties: 2-methylbenzimidazole, sulfonyl, and fluorophenyl groups. In our initial search, we looked for analogues that had two of these three moieties to see which moiety would contribute the most in terms of selectivity and potency. The second round of search was conducted for analogues that had all these three moieties connected the exact same way but that had small substitutions at various positions. All these analogues had at least 95% structural similarity to CB7. Over 118 compounds were purchased from ChemBridge Corp. and ENAMINE Ltd., Kiev, Ukraine, Princeton Biomolecular Research Ltd., Life Chemicals, and Vitas M. Laboratories. The purity of the compounds according to the vendor was >95%. Compounds were dissolved and diluted in 100% DMSO and stored at −20 °C. The analogues were tested for their selectivity against ALDH1A1, ALDH1A2, ALDH1A3, ALDH1B1, ALDH2, and ALDH3A1 at 100 μM. Compounds discussed in this study with their respective vendor and corresponding catalog numbers are listed in Table S1 in Supporting Information.
Determination of Kinetics Parameters
IC50 values were determined for CB7 and its analogues using propionaldehyde as a substrate for ALDH1A1, ALDH1A2, ALDH1A3, ALDH1B1, and ALDH2 and using benzaldehyde as a substrate for ALDH3A1. For these IC50 determinations, the enzymatic activities of ALDH1A1, ALDH1A2, ALDH1A3, ALDH1B1, ALDH2, and ALDH3A1 were monitored by calculating the increase in absorbance at 340 nm due to NAD(P)H formation (molar extinction coefficient of 6220 M–1 cm–1) on a Beckman DU-640 spectrophotometer in the presence of various concentrations of inhibitors ranging from 50 nM to 100 μM following a 1 min preincubation. ALDH1A2, ALDH1A3, and ALDH1B1 activity assays were measured spectrophotometrically in reaction solution containing 1 mM propionaldehyde, 1.5 mM NAD+, and 200 nM ALDH1A2, 150 nM ALDH1A3, and 200 nM ALDH1B1 of respective enzymes all in the presence of 25 mM BES buffer, pH 7.5. ALDH1A1 and ALDH2 activities were measured spectrophotometrically in a solution containing 200 nM enzyme, 1 mM propionaldehyde, 1.5 mM NAD+ all in the presence of 50 mM sodium BES at pH 7.5.33,44,45 ALDH3A1 activity was measured in 10 nM ALDH3A1, 1 mM benzaldehyde, and 1.5 mM NADP+ in 100 mM sodium phosphate buffer, pH 7.5.33,44,45 Reaction was initiated by the addition of the aldehyde substrate. There was no preincubation time-dependence to the inhibition. The inhibition curves were fit to the logistic four-parameter IC50 equation using the SigmaPlot (version 11, StatSys). Steady state kinetics experiments were performed by covarying inhibitor and substrate concentrations. The steady state kinetics measurements were performed in 100 mM Na2HPO4 buffer, pH 7.5. The reaction mixture contained 6 nM ALDH3A1, varied benzaldehyde (100–800 μM under fixed NADP+, 1.5 mM) at varied inhibitor concentration (0–200 nM), or varied NADP+ (100–500 μM; fixed benzaldehyde, 1 mM) at varied inhibitor concentrations (0–200 nM). All experiments including the controls contained 2% (v/v) DMSO. The initial rate of product formation was determined on a Beckman DU-640. All data were fit to the nonlinear velocity expressions for competitive, noncompetitive, mixed-type noncompetitive and uncompetitive inhibition.46 Appropriateness of the inhibition model was determined through analysis of goodness-of-fit and the residuals of those fits. Lineweaver–Burke plots were created using SigmaPlot (version 11, StatSys) to visualize the inhibition patterns. All data represent the average of three independent experiments utilizing triplicate assays at each concentration point.
Crystallization of ALDH3A1 with NAD+ and CB7
ALDH3A1 crystals were grown from solutions containing 0.2 M potassium acetate, 20% PEG 3350 at 25 °C. The enzyme concentration was 4 mg/mL in 10 mM HEPES buffer, pH 7.5. The enzyme was mixed with 1 mM NAD+ and 1 mM CB7. Sitting drop experiment was performed with 8 μL drop size and 1000 μL of mother liquor. Crystals were obtained in about a week. These crystals were frozen directly in gaseous nitrogen stream at 100 K without additional cryoprotectant. Data sets were collected at a wavelength of 0.9869 Å at 100 K at the Advanced Photon Source using beamline 19-ID operated by the Structural Biology Consortium Collaborative Access Team (SBC-CAT) located at Argonne National Laboratory. The diffraction data were indexed, integrated, and scaled using the HKL3000 program.47 Because of the presence of weak ice–ring diffraction in the images, the following macros were introduced into HKL3000, “reject fraction 0.70” and “reject slope 100”, in order to integrate through the slightly higher background in these regions of the diffraction images. All refinements were performed using the program package REFMAC548 as implemented in the CCP4 program suite,49 and model inspection and building were accomplished using Coot.50 The structure was solved by performing molecular replacement using the apo form of ALDH3A1 structure as the search model (PDB code 3SZA). Molecular replacement was performed using MOLREP program51 provided by CCP4 software.49 Initial maps showed clear electron density for the CB7 bound in the active site of two out of four monomers present in the asymmetric unit. The other two active sites showed weaker electron density consistent with partial occupancy, and CB7 was modeled into these active sites during later stages of refinement. All ligands demonstrated difference density features consistent with multiple conformers bound within each active site. However, the resolution of the data is insufficient for modeling of multiple conformations at occupancies of less than 50%. Consequently, the highest occupancy conformer is modeled into each active site and is assigned an occupancy value of 0.5, based on a comparison between the refined B-factors for the ligands and those of the surrounding active site residue side chains that are in contact with CB7. Water molecules were added after the addition of ligands in order to prevent inadvertent placement of water molecules into density features that represent the ligand. Ligands were sketched in Sketcher, as implemented in CCP4.49 This structure was used to create the library description file used in refinement.
Generation of Q122A and Q122W Mutants
In order to characterize the binding pattern of CB7 to catalytic site of ALDH3A1, two important mutations Q122A and Q122W were made. Point mutations of ALDH3A1 were performed using QuickChange (Qiagen) mutagenesis. ALDH3A1 mutants were constructed using forward primer 5′-CTT CAA CCT CAC CAT CGC GCC CAT GGT GGG CGCC-3′ and complement for Q122A and forward primer 5′-CCT TCA ACC TCA CCA TCT GGC CCA TGG TGG GCG CCA TC-3′ and complement for Q122W mutant. These two mutant proteins were purified exactly the same way as was ALDH3A1. However, the yield was significantly decreased compared to WT protein. Q122A was stored at 0.9 mg/mL and Q122W was stored at 0.4 mg/mL at −80 °C. Kinetics experiments were performed exactly the same way as the wild-type (WT) enzyme.
Analysis of ALDH3A1 Catalyzed Dehydrogenase Activities from Cell Lysates
Briefly, cells (A549, SF767, and CCD-13Lu) were washed with ice cold PBS to remove residual medium. Then 400 μL of RIPA buffer (Cell Signaling Technologies) containing 1 mM PMSF (Sigma Aldrich) was added to each 10 cm dish. Plates were incubated on ice for 5 min and scraped, and lysates were collected. Lysates were centrifuged for 10 min at 16000g in a microcentrifuge at 4 °C. Protein concentrations were measured using the Bradford reagent (Biorad Laboratories). Then 50 μg of cell lysate was used in the activity assay. ALDH3A1 activity in cell lysates was measured in 100 mM Na2HPO4 buffer at pH 7.5, with 1.5 mM NADP+ and 1 mM benzaldehyde. Activity assay was also performed with 1 μg of recombinant ALDH3A1 in the presence and absence of CB7 and its analogues A10, A20, A21, B27, A64, A70, and B37. All assays including the controls contained 1% (v/v) DMSO. These compounds were tested at 10 μM to monitor the extent of ALDH inhibition in these cell lysates and purified ALDH3A1. Lysates were treated with these compounds for 1 min before the substrate was added.
Mafosfamide Sensitivity Experiments
MTT assay was used for conducting mafosfamide chemosensitivity experiments. Mafosfamide was used for this study primarily because it is an analogue of cyclophosphamide and it does not require cytochrome P450 for its activation, which is ideal for cell based studies.52 Three cell lines, A549, SF767, and CCD-13Lu, were chosen for this study. These cell lines were chosen because A549 expresses both ALDH1A1 and ALDH3A115 and SF767 expresses only ALDH3A1, whereas CCD-13Lu expresses neither of these enzymes.36 CCD-13Lu cells were also relevant for this study because they are normal lung fibroblasts which serve as a proper control for A549, which is a carcinogenic cell line from lung. Our standardization measurements showed that 5000 cells/well is optimal for A549 and CCD-13Lu and that 10 000 cells/well is optimal for the SF767 cell line for a linear response of MTT assay. Approximate ED50 values for adenocarcinoma (A549), glioblastoma (SF767), and CCD-13Lu cells were 125, 150, and 40 μM, respectively.36 After optimization experiments, A549 (5000 cells/well), SF767 (10 000 cells/well), and CCD-13Lu (5000 cells/well) were seeded in 96-well plates. Twenty-nine hours later, A549, SF767, and CCD-13Lu cells were treated with 10 μM ALDH3A1 inhibitors (A10, A20, A21, A64, A70, B27, B37, and CB7) in the absence or in the presence of mafosfamide corresponding to their ED50 values. These compounds were chosen for chemosensitivity experiments because they showed the highest potency and selectivity in our SAR experiments and were closely related to each other. MTT assay was performed 19 h after ALDH3A1 inhibitor treatment to access cellular proliferation.32 The relative percentage of cell proliferation was calculated in comparison to DMSO (0.25%) treated controls. DMSO concentration was strictly limited to 0.25% for these experiments, which had no significant effect on cell viability by itself (data not shown). The time points for treatment were chosen based on similar experiments performed earlier.32
Acknowledgments
We thank Dr. Lan Chen and the entire Chemical Genomics facility for helping us with high-throughput screening. We thank Dr. Samantha Perez-Miller for assistance in the production of ALDH3A1, and Dr. Maureen Harrington for providing access to the cell culture facility. Results shown in this study are derived from work performed at the Argonne National Laboratory operated by University of Chicago, for the United States Department of Energy Office of Biological and Environmental Research under Contract DE-AC02-06CH11357. The authors especially thank Marianne Cuff and Stephan Ginell at SBC-CAT, beamline 19-ID, for their help. The research was supported by the U.S. National Institutes of Health (Grants R01AA018123 and R01AA019746) to T.D.H.) and an IUSM Core Pilot grant to T.D.H.
Glossary
Abbreviations Used
- DMSO
dimethyl sulfoxide
- IC50
half-maximal inhibitory concentration
- IPTG
isopropyl β-d-1-thiogalactopyranoside
- SAR
structure–activity relationship
- HTS
high throughput screening
- MF
mafosfamide
- ALDH
aldehyde dehydrogenase
- Ki
inhibition constant
- SF767
glioblastoma
- A549
lung adenocarcinoma
- NADP
nicotinamide adenine dinucleotide phosphate
- HEPES
(4-(2-hydroxyethyl)-1-piperazineethanesulfonic acid)
- PEG
polyethylene glycol
- DTT
dithiotheritol
- NAD+
nicotinamide adenine dinucleotide
- MTT
3-(4,5-dimethylthiazol-2-yl)-2,5-diphenyltetrazolium bromide
Supporting Information Available
Supplemental figures for sequence comparison of ALDH isoforms and a table providing information for compounds used in this study. This material is available free of charge via the Internet at http://pubs.acs.org.
The authors declare the following competing financial interest(s): Thomas D. Hurley holds significant financial equity in SAJE Pharma, LLC. However, none of the work described in this study is related to, based on, or supported by the company.
Accession Codes
The atomic coordinates and structure factors of ALDH3A1 have been deposited in the Protein Data Bank, Research Collaboratory for Structural Bioinformatics, Rutgers University, New Brunswick, NJ, with entry code 4L2O.
Funding Statement
National Institutes of Health, United States
Supplementary Material
References
- Vasiliou V.; Nerbert D. W. Analysis and update of the human aldehyde dehydrogenase (ALDH) gene family. Hum. Genomics 2005, 2, 138–143. [DOI] [PMC free article] [PubMed] [Google Scholar]
- Harada S.; Okubo T.; Nakamura T.; Fujii C.; Nomura F.; Higuchi S.; Tsutsumi M. A novel polymorphism (-357 G/A) of the ALDH2 gene: linkage disequilibrium and an association with alcoholism. Alcohol: Clin. Exp. Res. 1999, 23, 958–962. [PubMed] [Google Scholar]
- Larson H. N.; Zhou J.; Chen Z.; Stamler J. S.; Weiner H.; Hurley T. D. Structural and functional consequences of coenzyme binding to the inactive Asian variant of mitochondrial aldehyde dehydrogenase: roles of residues 475 and 487. J. Biol. Chem. 2007, 2821712940–12950. [DOI] [PMC free article] [PubMed] [Google Scholar]
- Chen Z.; Zhang J.; Stamler J. S. Identification of the enzymatic mechanism of nitroglycerin bioactivation. Proc. Natl. Acad. Sci. U.S.A. 2002, 99, 8306–8311. [DOI] [PMC free article] [PubMed] [Google Scholar]
- Chen Z.; Foster M. W.; Zhang J.; Mao L.; Rockman H. A.; Kawamoto T.; Kitagawa K.; Nakayama K. I.; Hess D. T.; Stamler J. S. An essential role for mitochondrial aldehyde dehydrogenase in nitroglycerin bioactivation. Proc. Natl. Acad. Sci. U.S.A. 2005, 102, 12159–12164. [DOI] [PMC free article] [PubMed] [Google Scholar]
- Yao L.; Fan P.; Arolfo M.; Jiang Z.; Olive M. F.; Zablocki J.; Sun H. L.; Chu N.; Lee J.; Kim H. Y.; Leung K.; Shryock J.; Blackburn B.; Diamond I. Inhibition of aldehyde dehydrogenase-2 suppresses cocaine seeking by generating THP, a cocaine use-dependent inhibitor of dopamine synthesis. Nat. Med. 2010, 16, 1024–1028. [DOI] [PMC free article] [PubMed] [Google Scholar]
- Chen C. H.; Budas G. R.; Churchill E. N.; Disatnik M. H.; Hurley T. D.; Rosen D. M. Activation of aldehyde dehydrogenase-2 reduces ischemic damage to the heart. Science 2008, 321, 1493–1495. [DOI] [PMC free article] [PubMed] [Google Scholar]
- Churchill E. N.; Disatnik M. H.; Mochly-Rosen D. Time-dependent and ethanol-induced cardiac protection from ischemia mediated by mitochondrial translocation of varepsilon PKC and activation of aldehyde dehydrogenase 2. J. Mol. Cell. Cardiol. 2009, 46, 278–284. [DOI] [PMC free article] [PubMed] [Google Scholar]
- Budas G. R.; Disatnik M. H.; Chen C. H.; Mochly-Rosen D. Activation of aldehyde dehydrogenase 2 (ALDH2) confers cardioprotection in protein kinase C epsilon (PKC varepsilon) knockout mice. J. Mol. Cell. Cardiol. 2010, 48, 757–764. [DOI] [PMC free article] [PubMed] [Google Scholar]
- De L. V.; Rogers G. R.; Hamrock D. J.; Marekov L. N.; Steinert P. M.; Compton J. G.; Markova N.; Rizzo W. B. Sjögren–Larsson syndrome is caused by mutations in the fatty aldehyde dehydrogenase gene. Nat. Genet. 1996, 12, 52–57. [DOI] [PubMed] [Google Scholar]
- Valle D.; Goodman S. I.; Applegarth D. A.; Shih V. E.; Phang J. M. Type II hyperprolinemia. Delta1-pyrroline-5-carboxylic acid dehydrogenase deficiency in cultured skin fibroblasts and circulating lymphocytes. J. Clin. Invest. 1976, 58, 598–603. [DOI] [PMC free article] [PubMed] [Google Scholar]
- Geraghty M. T.; Vaughn D.; Nicholson A. J.; Lin W. W.; Jimenez-Sanchez G.; Obie C.; Flynn M. P.; Valle D.; Hu C. A. Mutations in the Delta1-pyrroline 5-carboxylate dehydrogenase gene cause type II hyperprolinemia. Hum. Mol. Genet. 1998, 791411–1415. [DOI] [PubMed] [Google Scholar]
- Marcato P.; Dean C. A.; Giacomantonio C. A.; Lee P. W. Aldehyde dehydrogenase: its role as a cancer stem cell marker comes down to the specific isoform. Cell Cycle 2011, 1091378–1384. [DOI] [PubMed] [Google Scholar]
- Moreb J. S. Aldehyde dehydrogenase as a marker for stem cells. Curr. Stem Cell Res. Ther. 2008, 34237–246. [DOI] [PubMed] [Google Scholar]
- Moreb J. S.; Mohuczy D.; Ostamark B.; Zucali J. R. RNAi-mediated knockdown of aldehyde dehydrogenase class-1A1 and class-3A1 is specific and reveals that each contributes equally to the resistance against 4-hydroperoxycyclophosphamide. Cancer Chemother. Pharmacol. 2007, 59, 127–136. [DOI] [PubMed] [Google Scholar]
- Muzio G.; Maggiora M.; Paiuzzi E.; Oraldi M.; Canuto R. A. Aldehyde dehydrogenases and cell proliferation. Free Radical Biol. Med. 2012, 524735–746. [DOI] [PubMed] [Google Scholar]
- Emadi A.; Jones R. J.; Brodsky R. A. Cyclophosphamide and cancer: golden anniversary. Nat. Rev. Clin. Oncol. 2009, 611638–647. [DOI] [PubMed] [Google Scholar]
- Estey T.; Cantore M.; Weston P. A.; Carpenter J. F.; Petrash J. M.; Vasiliou V. Mechanisms involved in the protection of UV-induced protein inactivation by the corneal Crystallin ALDH3A1. J. Biol. Chem. 2007, 282, 4382–4392. [DOI] [PubMed] [Google Scholar]
- Boesch J. S.; Lee C.; Lindahl R. G. Constitutive expression of class 3 aldehyde dehydrogenase in cultured rat corneal epithelium. J. Biol. Chem. 1996, 271, 5150–5157. [DOI] [PubMed] [Google Scholar]
- Abedinia M.; Pain T.; Algar E. M.; Holmes R. S. Bovine corneal aldehyde dehydrogenase: the major soluble corneal protein with a possible dual protective role for the eye. Exp. Eye Res. 1990, 514419–426. [DOI] [PubMed] [Google Scholar]
- Sreerama L.; Rekha G. K.; Sládek N. E. Phenolic antioxidant-induced overexpression of class-3 aldehyde dehydrogenase and oxazaphosphorine-specific resistance. Biochem. Pharmacol. 1995, 49, 669–675. [DOI] [PubMed] [Google Scholar]
- Lassen N.; Bateman J. B.; Estey T.; Kuszak J. R.; Nees D. W.; Piatigorsky J.; Duester G.; Day B. J.; Huang J.; Hines L. M.; Vasiliou V. Multiple and additive functions of ALDH3A1 and ALDH1A1: cataract phenotype and ocular oxidative damage in Aldh3a1 (−/−) and Aldh1a1 (−/−) knockout mice. J. Biol. Chem. 2007, 2823525668–25676. [DOI] [PMC free article] [PubMed] [Google Scholar]
- Sreerama L.; Sladek N. E. Cellular levels of class 1 and class 3 aldehyde dehydrogenases and certain other drug-metabolizing enzymes in human breast malignancies. Clin. Cancer Res. 1997, 3, 1901–1914. [PubMed] [Google Scholar]
- Rekha G. K.; Sreerama L.; Sladek N. E. Intrinsic cellular resistance to oxazaphosphorines exhibited by a human colon carcinoma cell line expressing relatively large amounts of a class-3 aldehyde dehydrogenase. Biochem. Pharmacol. 1994, 48101943–1952. [DOI] [PubMed] [Google Scholar]
- Rekha G. K.; Devaraj V. R.; Sreerama L.; Lee M. J.; Nagasawa H. T.; Sladek N. E. Inhibition of human class 3 aldehyde dehydrogenase, and sensitization of tumor cells that express significant amounts of this enzyme to oxazaphosphorines, by chlorpropamide analogues. Biochem. Pharmacol. 1998, 554465–474. [DOI] [PubMed] [Google Scholar]
- Sreerama L.; Sladek N. E. Identification and characterization of a novel class 3 aldehyde dehydrogenase overexpressed in a human breast adenocarcinoma cell line exhibiting oxazaphosphorine-specific acquired resistance. Biochem. Pharmacol. 1993, 45122487–2505. [DOI] [PubMed] [Google Scholar]
- Hu G.; Chong R. A.; Yang Q.; Wei Y.; Blanco M. A.; Li F.; Reiss M.; Au J. L.; Haffty B. G.; Kang Y. MTDH activation by 8q22 genomic gain promotes chemoresistance and metastasis of poor-prognosis breast cancer. Cancer Cell 2009, 15, 9–20. [DOI] [PMC free article] [PubMed] [Google Scholar]
- Sladek N. E.; Kollander R.; Sreerama L.; Kiang D. T. Cellular levels of aldehyde dehydrogenases (ALDH1A1 and ALDH3A1) as predictors of therapeutic responses to cyclophosphamide-based chemotherapy of breast cancer: a retrospective study. Rational individualization of oxazaphosphorine-based cancer chemotherapeutic regimens. Cancer Chemother. Pharmacol. 2002, 49, 309–321. [DOI] [PubMed] [Google Scholar]
- Wang J. S.; Fang Q.; Sun D. J.; Chen J.; Zhou X. L.; Lin G. W.; Lu H. J.; Fei J. Genetic modification of hematopoietic progenitor cells for combined resistance to 4-hydroperoxycyclophosphamide, vincristine, and daunorubicin. Acta Pharmacol. Sin. 2001, 22, 949–955. [PubMed] [Google Scholar]
- Sreerama L.; Sladek N. E. Human breast adenocarcinoma MCF-7/0 cells electroporated with cytosolic class 3 aldehyde dehydrogenases obtained from tumor cells and a normal tissue exhibit differential sensitivity to mafosfamide. Drug Metab. Dispos. 1995, 23101080–1084. [PubMed] [Google Scholar]
- Devaraj V. R.; Sreerama L.; Lee M. J.; Nagasawa H. T.; Sladek N. E. Yeast aldehyde dehydrogenase sensitivity to inhibition by chlorpropamide analogues as an indicator of human aldehyde dehydrogenase sensitivity to these agents. Adv. Exp. Med. Biol. 1997, 414, 155–169. [DOI] [PubMed] [Google Scholar]
- Khanna M.; Chen C. H.; Kimble-Hill A.; Parajuli B.; Perez-Miller S.; Baskaran S.; Kim J.; Vasiliou V.; Mochly-Rosen D.; Hurley T. D. Discovery of a novel class of covalent inhibitor for aldehyde dehydrogenases. J. Biol. Chem. 2011, 2865043486–43494. [DOI] [PMC free article] [PubMed] [Google Scholar]
- Parajuli B.; Kimble-Hill A. C.; Khanna M.; Ivanova Y.; Meroueh S.; Hurley T. D. Discovery of novel regulators of aldehyde dehydrogenase isoenzymes. Chem.-Biol. Interact. 2011, 191, 153–158. [DOI] [PMC free article] [PubMed] [Google Scholar]
- Liu Z. J.; Sun Y. J.; Rose J.; Chung Y. J.; Hsiao C. D.; Chang W. R.; Kuo I.; Perozich J.; Lindahl R.; Hempel J.; Wang B. C. The first structure of an aldehyde dehydrogenase reveals novel interactions between NAD and Rossmann fold. Nat. Struct. Biol. 1997, 44317–326. [DOI] [PubMed] [Google Scholar]
- Perez-Miller S.; Hurley T. D. Coenzyme isomerization is integral to catalysis in aldehyde dehydrogenase. Biochemistry 2003, 42, 7100–7109. [DOI] [PubMed] [Google Scholar]
- Parajuli B.; Georgiadis T. M.; Fishel M. L.; Hurley T. D.. Development of selective inhibitors for human aldehyde dehydrogenase 3A1 (ALDH3A1) for the enhancement of cyclophosphamide cytotoxicity. ChemBioChem, in press. [DOI] [PMC free article] [PubMed] [Google Scholar]
- Sladek N. E. Aldehyde dehydrogenase mediated cellular relative insensitivity to the oxazaphosphorines. Curr. Pharm. Des. 1999, 5, 607–625. [PubMed] [Google Scholar]
- Moreb J. S.; Gabr A.; Vartikar G. R.; Gowda S.; Zucali J. R.; Mohuczy D. Retinoic acid down-regulates aldehyde dehydrogenase and increases cytotoxicity of 4-hydroperoxycyclophosphamide and acetaldehyde. J. Pharmacol. Exp. Ther. 2005, 312, 339–345. [DOI] [PubMed] [Google Scholar]
- Giorgianni F.; Bridson P. K.; Sorrentino B. P.; Blakley R. L. Inactivation of aldophosphamide by human aldehyde dehydrogenase isozyme 3. Biochem. Pharmacol. 2000, 603325–338. [DOI] [PubMed] [Google Scholar]
- Hertenstein B.; Stefanic M.; Schemiser T.; Scholz M.; Goller V.; Clausen M.; Bunjes D.; Wiesneth M.; Novotny J.; Kochs M. Cardiac toxicity of bone marrow transplantation: predictive value of cardiologic evaluation before transplantation. J. Clin. Oncol. 1994, 125998–1004. [DOI] [PubMed] [Google Scholar]
- Boumpas D. T; Austin H. A. 3rd; Vaughan E. M.; Yarboro C. H.; Klippel J. H.; Balow J. E. Risk for sustained amenorrhea in patients with systemic lupus erythematous receiving intermittent pulse cyclophosphamide therapy. Ann. Intern. Med. 1993, 1195366–369. [DOI] [PubMed] [Google Scholar]
- Stillwell T. J.; Benson R. C. Jr.; DeRemee R. A.; McDonald T. J.; Weiland L. H. Cyclophosphamide-induced bladder toxicity in Wegener’s granulomatosis. Arthritis Rheum. 1988, 314465–470. [DOI] [PubMed] [Google Scholar]
- Tschöp K.; Rommel F.; Schmidkonz P.; Emmerich B.; Schulze J. Neuropathy after cyclophosphamide high dose chemotherapy in a Morbus Werlhof patient. Dtsch. Med. Wochenschr. 2001, 12612T17–T20. [DOI] [PubMed] [Google Scholar]
- Hammen P. K.; Allali-Hassani A.; Hallenga K.; Hurley T. D.; Weiner H. Multiple conformations of NAD and NADH when bound to human cytosolic and mitochondrial aldehyde dehydrogenase. Biochemistry 2002, 41, 7156–7168. [DOI] [PubMed] [Google Scholar]
- Weiner H.; Hu J. H.; Sanny C. G. Rate-limiting steps for the esterase and dehydrogenase reaction catalyzed by horse liver aldehyde dehydrogenase. J. Biol. Chem. 1976, 251133853–3855. [PubMed] [Google Scholar]
- Segel I. H.Simple Inhibition Systems. Enzyme Kinetics: Behavior and Analysis of Rapid Equilibrium and Steady-State Enzyme Systems; John Wiley and Sons, Inc.: New York, 1993; pp 100–159. [Google Scholar]
- Minor W.; Cymborowski M.; Otwinowski Z.; Chruszcz M. HKL-3000: the integration of data reduction and structure solution—from diffraction images to an initial model in minutes. Acta Crystallogr., Sect. D: Biol. Crystallogr. 2006, 62, 859–866. [DOI] [PubMed] [Google Scholar]
- Murshudov G. N.; Skubak P.; Lebedev A. A.; Pannu N. S.; Steiner R. A.; Nicholls R. A.; Winn M. D.; Long F.; Vagin A. A. REFMAC5 for the refinement of macromolecular crystal structures. Acta Crystallogr., Sect. D: Biol. Crystallogr. 2011, 674355–367. [DOI] [PMC free article] [PubMed] [Google Scholar]
- Potterton E.; McNicholas S.; Krissinel E.; Cowtan K.; Noble M. The CCP4 molecular graphics project. Acta Crystallogr., Sect. D: Biol. Crystallogr. 2002, 58111955–1957. [DOI] [PubMed] [Google Scholar]
- Emsley P.; Cowtan K. Coot: model-building tools for molecular graphics. Acta Crystallogr., Sect. D: Biol. Crystallogr. 2004, 60, 2126–2132. [DOI] [PubMed] [Google Scholar]
- Vagin A.; Teplyakov A. Molecular replacement with MOLREP. Acta Crystallogr., Sect. D: Biol. Crystallogr. 2010, 66Part 122–25. [DOI] [PubMed] [Google Scholar]
- Blaney S. M.; Balis F. M.; Berg S.; Arndt C. A. S.; Heideman R.; Geyer J. R.; Packer R.; Adamson P. C.; Jaeckle K.; Klenke R.; Aikin A.; Murphy R.; McCully C.; Poplack D. G. Intrathecal mafosfamide: a clinical pharmacology and phase I trial. J. Clin. Oncol. 2005, 2371555–1563. [DOI] [PubMed] [Google Scholar]
- Adams P. D.; Afonine P. V.; Bunkóczi G.; Chen V. B.; Davis I. W.; Echols N.; Headd J. J.; Hung L.-W.; Kapral G. J.; Grosse-Kunstleve R. W.; McCoy A. J.; Moriarty N. W.; Oeffner R.; Read R. J.; Richardson D. C.; Richardson J. S.; Terwilliger T. C.; Zwart P. H.. PHENIX: a comprehensive Python-based system for macromolecular structure solution. Acta Crystallogr., Sect. D: Biol. Crystallogr. 2010, 66, 213–221. [DOI] [PMC free article] [PubMed] [Google Scholar]
Associated Data
This section collects any data citations, data availability statements, or supplementary materials included in this article.


