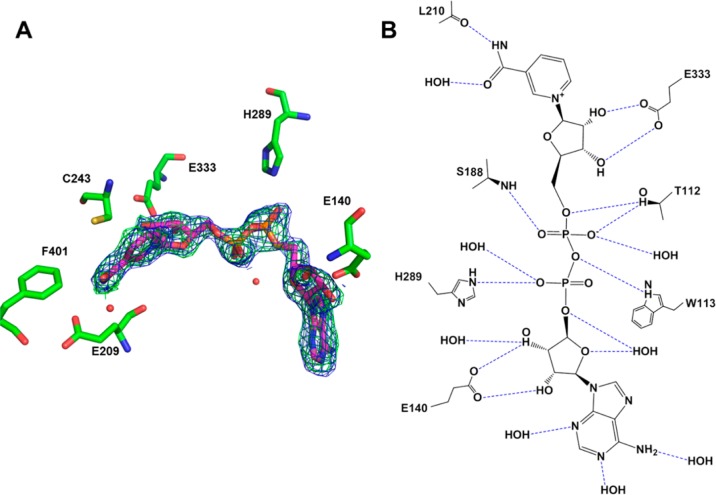
Figure 5.
Binding of NAD+ to ALDH3A1 (PDB code 4L2O). (A) Cofactor binding site of ALDH3A1 with NAD+ bound. The electron density maps displayed are the original σA-weighted Fo – Fc map contoured at 2.5 standard deviations (green) and the original σA-weighted 2Fo – Fc map contoured at 1 standard deviation (blue) superimposed on the final refined model of NAD+ bound in the enzyme active site. Selected residues involved in strong hydrogen bonding interactions and hydrophobic interactions are shown. (B) Two-dimensional map showing all the hydrogen bonds between NAD+ and ALDH3A1. Hydrogen bonds with a distance of <3.2 Å are shown by blue dotted lines.

