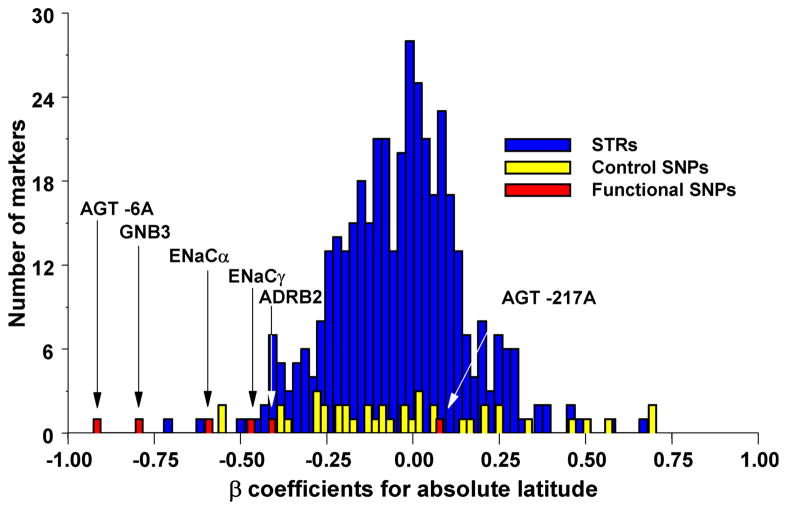
Figure 4. Outlier approaches to identify candidate targets of selection.
Outlier approaches simply rank all SNPs from a large-scale survey based on the value of a test statistic, e.g. FST, and then take all SNPs above a specified cut-off as targets of selection. This is based on the assumption that selection is sufficiently strong to generate extreme spatial patterns compared to the rest of the genome. The power and accuracy of these approaches depends on a number of variables, including the proportion of loci affected by selection and the strength of selection105.
In a similar vein, specific candidate SNPs can be evaluated against a large collection of SNPs to determine if the spatial patterns at candidate SNP is unusual relative to the rest of the genome. (A) Correlation between allele frequency and latitude for candidate susceptibility SNPs for hypertension (in red) compared to random microsatellites (STRs; in blue) and SNPs (in yellow) 53. (B) Differentiation of allele frequency in loci (A–K) involved in natural variation in skin pigmentation compared to a large collection of random SNPs 75. The dotted line shows the position beyond which 5% of the random SNPs fall, and the solid line the position beyond which 1% of the random SNPs fall.

