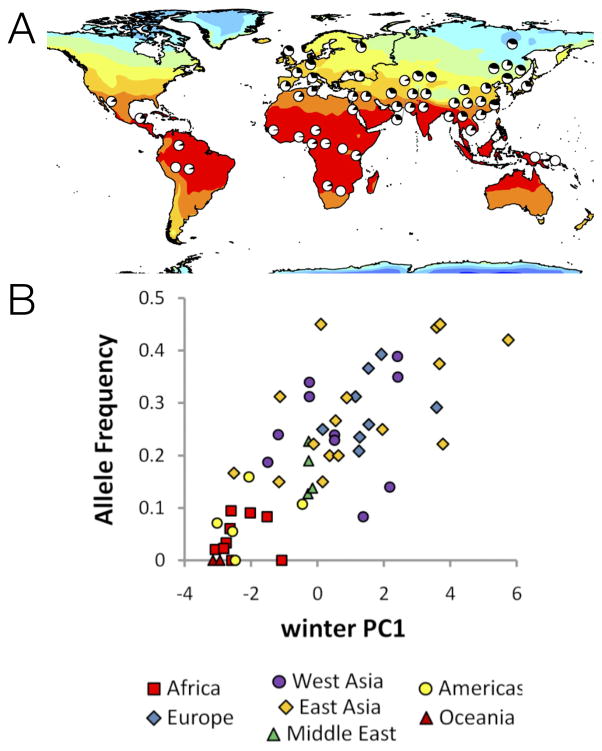
Figure 5. Correlation of a SNP in the RPTOR gene with environmental variables.
(A) Pie charts show the frequency of the derived allele at SNP rs12946049 in the RPTOR gene in the HGDP panel51. Color intensities represent the maximum temperature in the winter. (B) Allele frequency at rs12946049 as a function of distance from the equator. Qualitatively, the correlation is convincing for three reasons. First, the variation correlates strongly with an environmental feature in ways that depart from background spatial patterns (e.g., distantly related populations sharing the same environment – tropical Americas, Oceania and sub-Saharan Africa – have similar allele frequencies). Second, the correlation exists within multiple world regions, as shown in panel B. Interestingly, the extent of allele frequency differentiation at this SNP is not extreme (ranging from 0 to 0.5 frequency).

