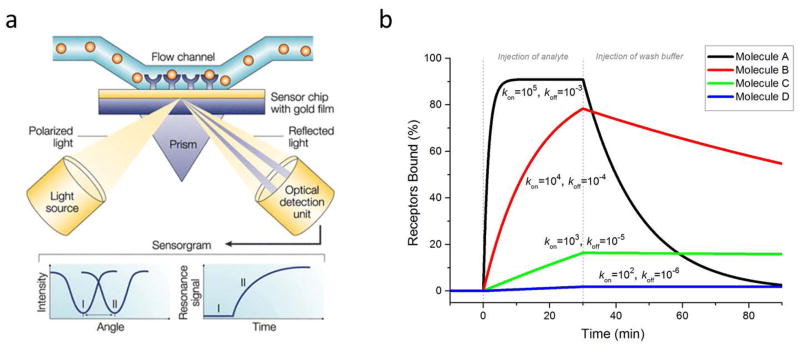
Figure 1.
(a) Schematic of typical SPR device. Light is directed onto a gold film and the reflection is monitored with a detector. At a certain angle, the light does not reflect but generates surface plasmon resonance (SPR). In a flow cell above the film, receptors are linked to the film and analyte solution is flowed past the receptors. If the analyte binds to the receptors, the angle at which SPR is generated shifts, and this angle is tracked over time as the reaction progresses. (b) Simulated SPR binding curves of four different molecules (A,B,C,D) with identical KD values (10 nM), but different rate constants, kon and koff. Analyte concentration was 100 nM for all molecules. Units for kon are M−1s−1 and for koff, s−1. This plot demonstrates the significance of knowing the kinetic constants. Molecule A would bind quickly and dissociate quickly, whereas molecule D would bind slowly but dissociate very slowly. The half-lives (t1/2 = ln 2/koff) of the bound complexes are roughly (from A–D): 12 min, 2 hr, 20 hr, and 8 days. (a) is adapted from Cooper [9] and used with permission of Macmillan Publishers Ltd.

