Figure 3.
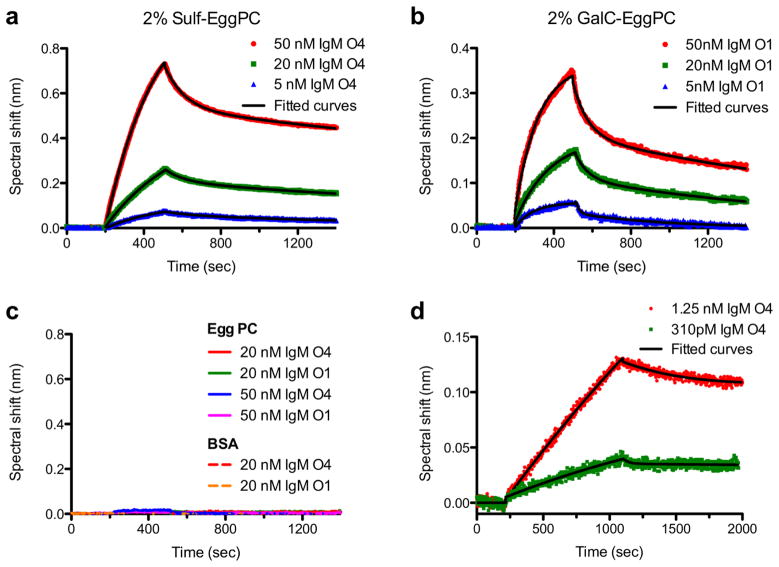
SPR characterization of remyelinating IgMs binding to supported lipid bilayers (SLB). (a) SPR kinetics curves of antibody O4 (5 – 50 nM) binding to a SLB containing 2 mole % sulfatide (Sulf). (b) SPR kinetics curves of antibody O1 (5 – 50 nM) binding to a SLB containing 2 mole % galactocerebroside (GalC). (c) Negative controls showing that neither O1 nor O4 bind to SLBs composed solely of egg phosphatidylcholine (egg PC) (solid lines). O1 and O4 did not bind to the sensor protected only by BSA blocking in the absence of a SLB (dashed lines). (d) SPR kinetics curves for 1.25 nM and 310 pM O4 binding to a SLB that mimics the Sulf and GalC content of myelin: 6 mole % Sulf, 16 mole % GalC. In all panels the solid black lines are exponential fits to the data used to extract association and dissociation rate constants. From Wittenberg et al., [67] and used with permission of the American Chemical Society.

