
Figure 6.
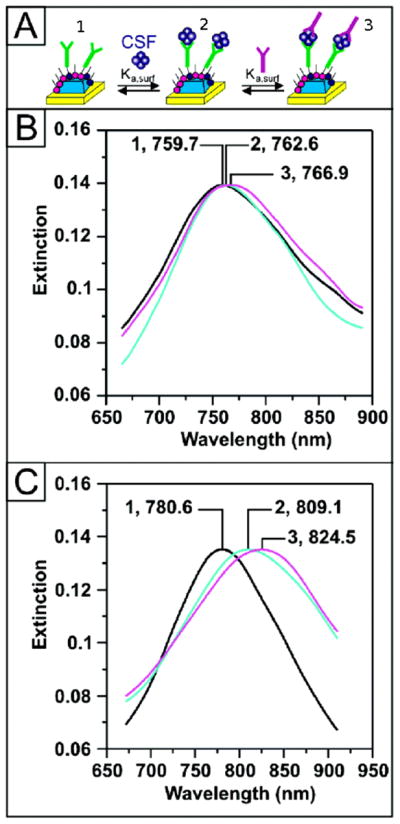
Detection of Alzheimer’s disease biomarker ADDL in human CSF samples using a sandwich assay and SPR. The SPR signal is monitored as peaks in the extinction (i.e. absorption) spectrum of the SPR sensor and molecular binding is indicated by a red-shift in the spectrum. (A) Illustration showing (1) anti-ADDL immobilization on the SPR sensor, (2) capture of ADDL, and (3) addition of second anti-ADDL to amplify changes is SPR signal. (B) Sensor response to CSF of an aging control patient: After functionalization with (B-1) 100 nM anti-ADDL (λmax = 759.7 nm), (B-2) CSF (λmax= 762.6 nm), and (B-3) 100 nM anti-ADDL (λmax = 766.9 nm). (C) Sensor response to CSF from an AD patient: After functionalization with (C-1) 100 nM anti-ADDL (λmax = 780.6 nm), (C-2) CSF (λmax = 809.1 nm), and (C-3) 100 nM anti-ADDL (λmax = 824.5 nm). Figure adapted from Haes et al.[108] and used with permission of the American Chemical Society.