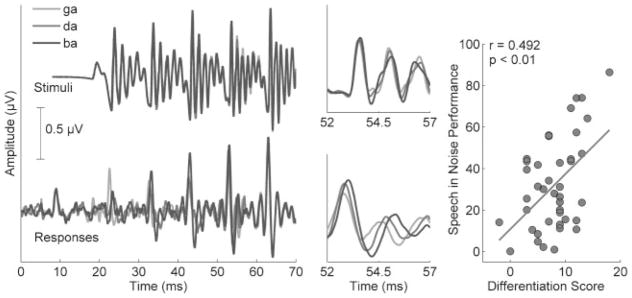
Figure 5.

Time domain grand average responses to three speech syllables ([ga], [da], and [ba]) of 20 typically developing children (bottom panels) reflect differences in stimulus timing and cochlear tonotopicity that are not seen in the stimulus waveforms (top panels). The 52- to 57-millisecond region is magnified to highlight these timing differences. The scatter plot on the right demonstrates the relationship between speech-in-noise performance (Hearing in Noise Test [HINT]) and differentiation scores (the degree to which the response latencies of the three syllables correspond to the expected pattern). Modified from Hornickel et al, Proc Natl Acad Sci U S A 2009.50
