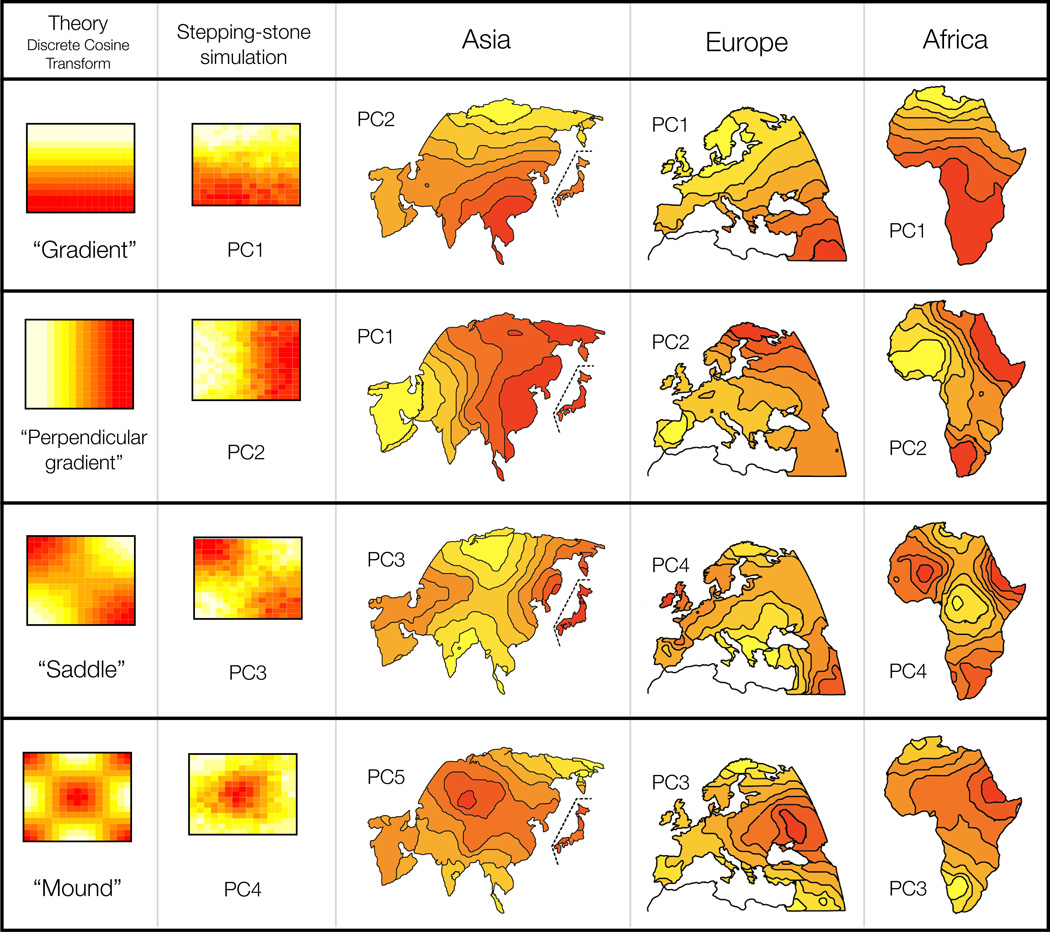
Figure 1.
Comparison of PC-maps of [3] with theoretical and empirical predictions. The first column shows the theoretical expected PC-maps for a class of models in which genetic similarity decays with geographic distance (see text for details). The second column shows PC-maps for population genetic data simulated with no range expansions, but constant homogeneous migration rate in a 2-dimensional habitat. The columns marked Asia, Europe, and Africa are redrawn from the originals of [3]. Each map is marked by which PC it represents. The order of maps in each of the last three columns was chosen to correspond with the shapes in the first two columns.

