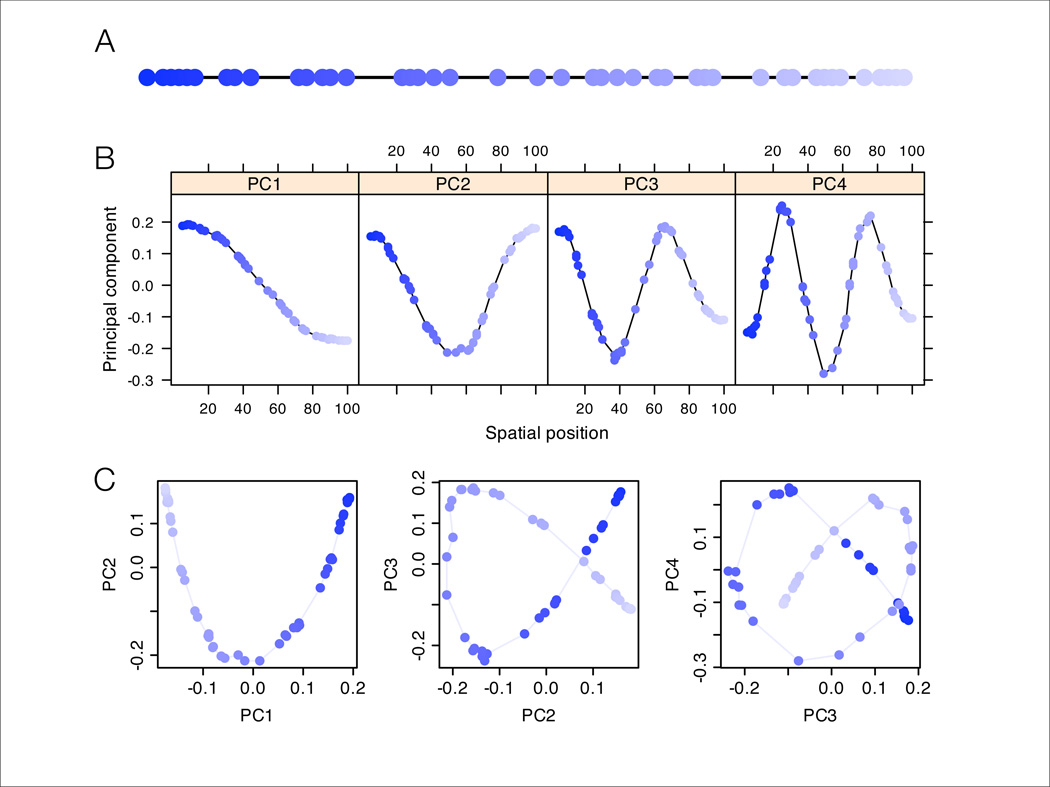
Figure 2.
Results of PCA applied to data from a one-dimensional habitat. (A) Schematic of the one-dimensional habitat, with circles marking sampling locations and shades of blue marking order along the line. (B) One-dimensional PC-maps (i.e. plots of each PC element against the geographic position of the corresponding sample location). (C) Biplots of PC1 vs. PC2, PC2 vs. PC3, and PC3 vs. PC4. Colors correspond to those in Panel A. In many datasets without spatially referenced samples, the colors and the lines connecting neighboring points would not be observed; here they are shown to aid interpretation.

