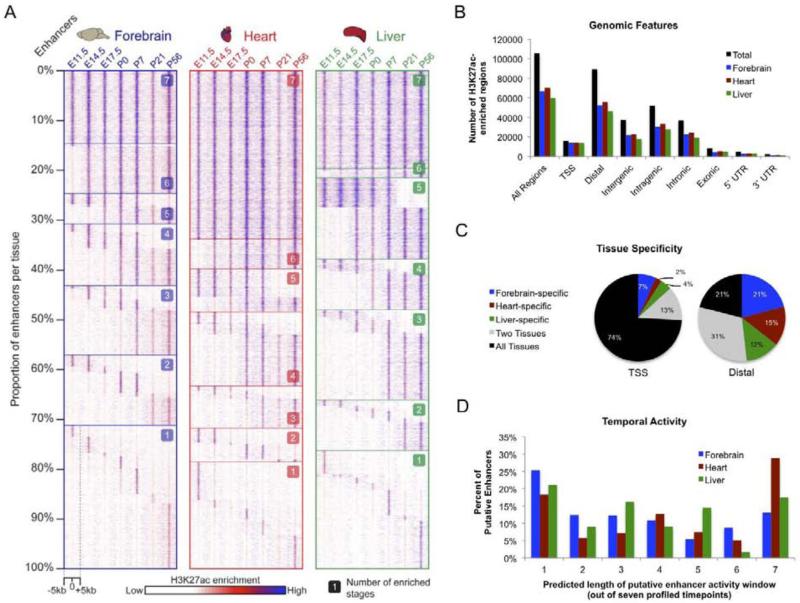
Figure 2. Developmental enhancers exhibit dynamic H3K27ac enrichment associated with in vivo activity.
A. Heatmap displaying H3K27ac enrichment by tissue and timepoint for putative distal enhancers (forebrain n=52,175; heart n=55,869; liver n=46,062). For each tissue, each row of the heatmap shows relative H3K27ac enrichment at one enhancer, with signal across the surrounding 10kb region plotted. Enhancers are organized by the number of timepoints at which the enhancer is active, starting with constitutively active enhancers at the top and proceeding down to single-stage enhancers at the bottom. B. Breakdown on H3K27ac enrichment across genomic features. C. Tissue specificity for TSS and distal H3K27ac enrichment. D. Predicted length of putative distal enhancer activity based on H3K27ac enrichment across seven profiled timepoints. (See also Supplementary Fig. 2).

