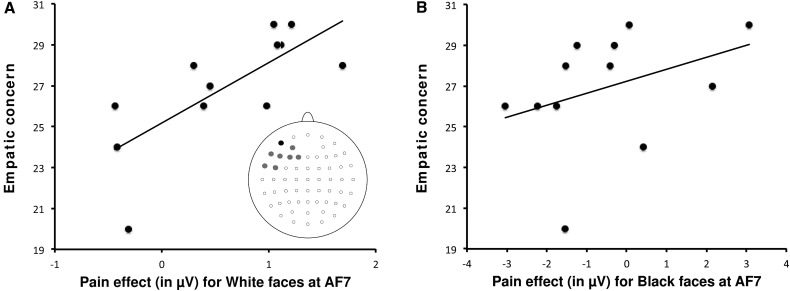
Fig. 5.
(A) Scatterplot of the correlation between individual EC ratings and the pain effect observed at the electrode site AF7 in the time range of the N2–N3 components for white faces. Pain effect was computed by subtracting waveforms elicited in the nonpainful stimulation condition from the waveforms elicited in the painful condition. A schematic illustration of the EEG montage shows the electrode sites on the scalp for which correlations were significant (AF7 in black color, AF3, F7, F5, F3, F1, FT7 and FC5 in gray color). (B) Scatterplot of the correlation between individual EC ratings and the pain effect observed at the electrode site AF7 in the time range of the N2–N3 components for black/other-race faces.

