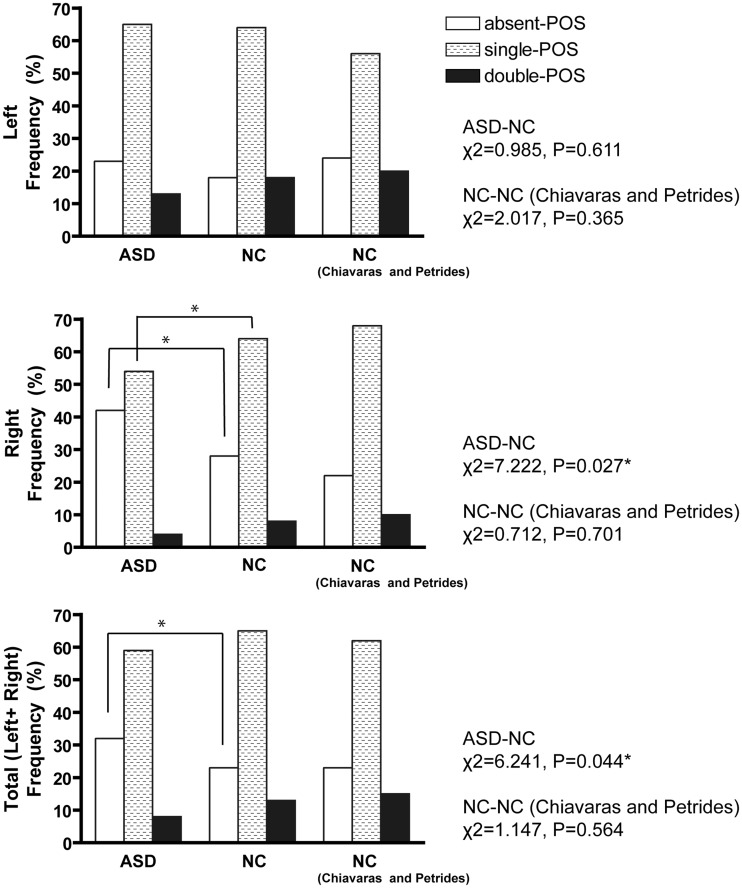
Fig. 3.
Sulcal pattern distribution of the POS in the OFC. Right column shows results from Chiavaras and Petrides (2000). Post hoc tests showed significant increase of the absent POS in the right hemisphere (χ2 = 7.213, P = 0.007) and bilateral hemispheres (χ2 = 6.078, P = 0.014), and decrease of the ‘single POS’ in the right hemisphere (χ2 = 5.297, P = 0.021). *Significant difference thresholded at P = 0.05.

