
Figure 2. Effectiveness of MLM using MR random or MT top associated markers in correcting for stratification.
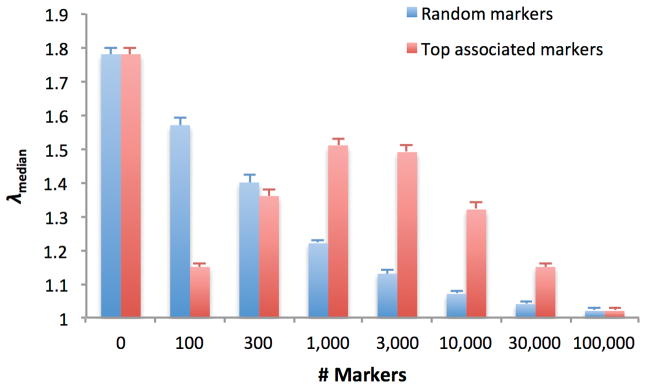
We report the average λmedian (± standard error) in 100 simulations with population stratification based on N=10,000 samples, M=100,000 markers, two discrete subpopulations with FST=0.005, and a mean trait difference of 0.25 standard deviations between subpopulations. Calibration of small P-values is reported in Supplementary Table 4.