
Figure 3. Effectiveness of MLM using MT top associated markers in increasing study power.
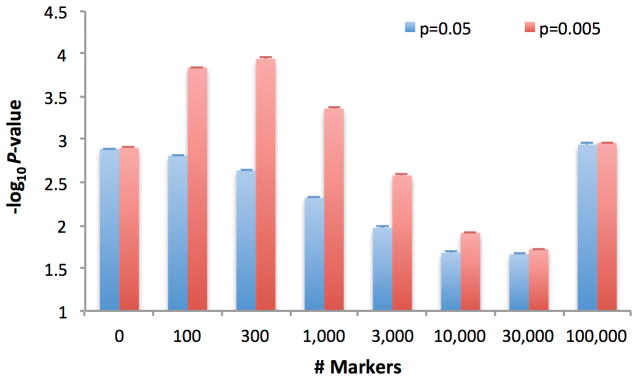
We report average −log10P-values (± standard error) at causal markers in 100 simulations based on N=10,000 samples, M=100,000 markers, and fraction p=0.05 or p=0.005 of causal markers. Power to detect significant associations at different P-value thresholds is reported in Supplementary Table 5.