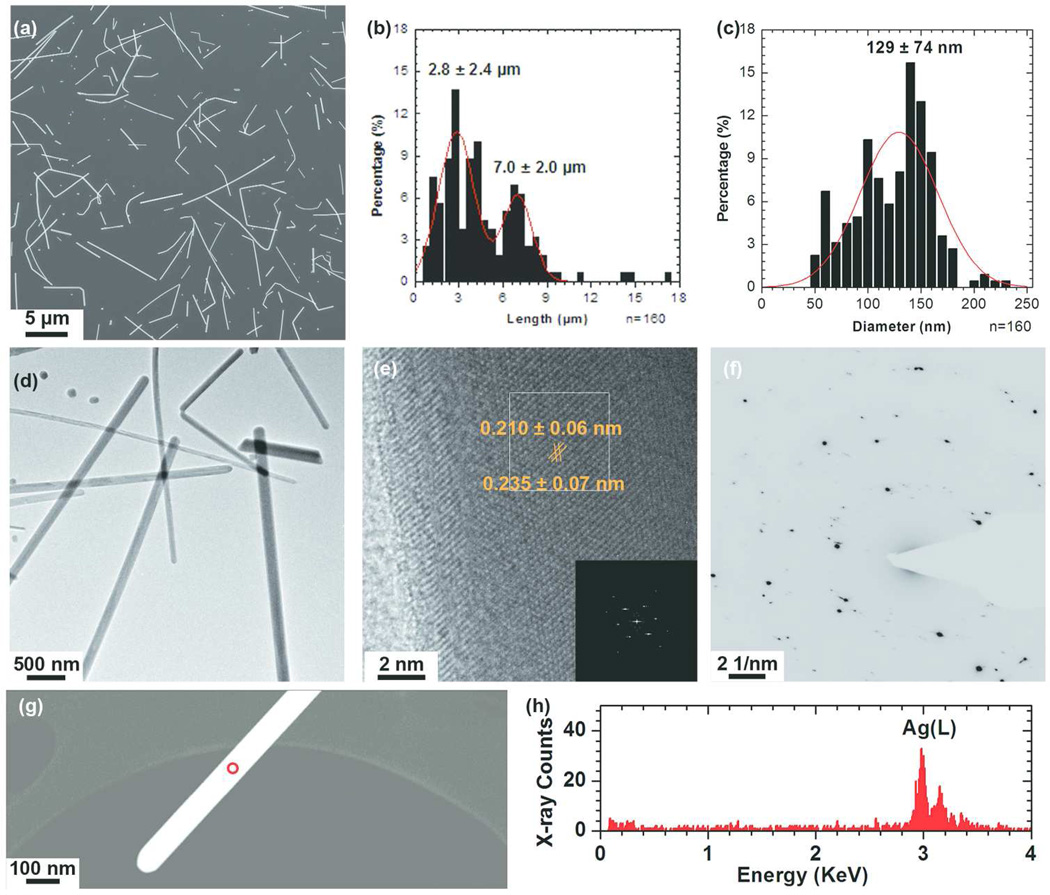
Figure 1.
Physicochemical characterization of as-synthesized AgNWs by SEM, TEM and SAED. (a) SEM image of as-synthesized AgNWs and their (b) length and (c) diameter distribution. The curves represent the Gaussian fit to the data. (d) A low-resolution bright field (BF) TEM image of the AgNWs. (e) A high-resolution BF-TEM image of a single AgNW, revealing its crystal structure. The inset is the corresponding FFT pattern taken from the boxed area. (f) SAED pattern taken from a region containing several AgNWs, using a selected area aperture size of ~560 nm. (g) HAADF-STEM image of a single AgNW and (h) the corresponding EDX spectrum taken from the area circled in (g). The two peaks at 2.98 keV and 3.15 keV correspond to the Ag(Lα) and Ag(Lβ) peaks respectively.

