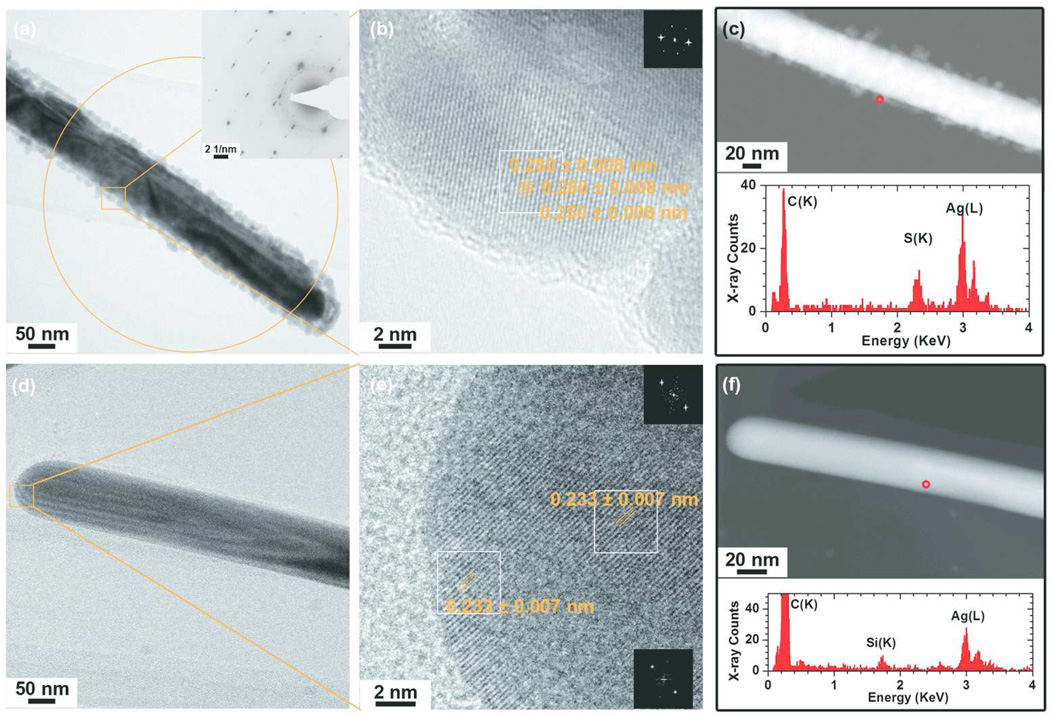
Figure 4.
Physicochemical characterization of AgNWs incubated for 6h at 37 ° C, in: (a–c) small molecule solutes and salts extracted from DCCM-1, (d–f) PBS/proteins extracted from DCCM-1. (a) A representative BF-TEM image of the AgNWs. The inset is a SAED pattern obtained from the circled area (aperture size ~550 nm). (b) HRTEM image taken from the area boxed in Fig. 4a. FFT patterns taken from the boxed areas are inserted. (c-top) HAADF-STEM image obtained from the same area as Fig. 4a. An EDX spectrum collected from the edge of the nanowire (circled in Fig. 4c-top), is shown in (c-bottom). (d) A BF-TEM image of the AgNWs. (e) HRTEM image taken from the boxed area in Fig. 4d. (f) A HAADF-STEM image of the AgNWs (top) and EDX spectrum (bottom) recorded at the surface of the AgNWs (circled in Fig. 4f-top). The silicon peak arises from contamination on the carbon coated TEM grid.42

