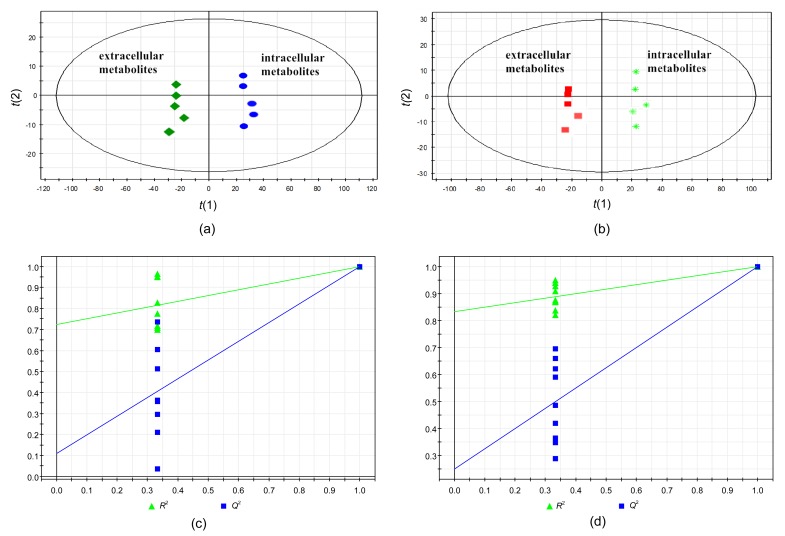
Fig. 6.
OPLS-DA score plots demonstrating the differentiation in intracellular and extracellular metabolites samples
OPLS-DA score plots of 60% Meth (a) and 80% Meth (b) quenching groups. Permutation tests for OPLS models of the 60% Meth (c) and 80% Meth (d) quenching groups. t(1) and t(2) are the X scores for the two predictive components using supervision methods, and SIMCA-P displays the plot of the correlation coefficient between the original Y and the permuted Y versus the cumulative R 2 and Q 2, and draws the regression line, in which the intercept (R 2 and Q 2 when correlation coefficient is zero) is a measure of the overfit

