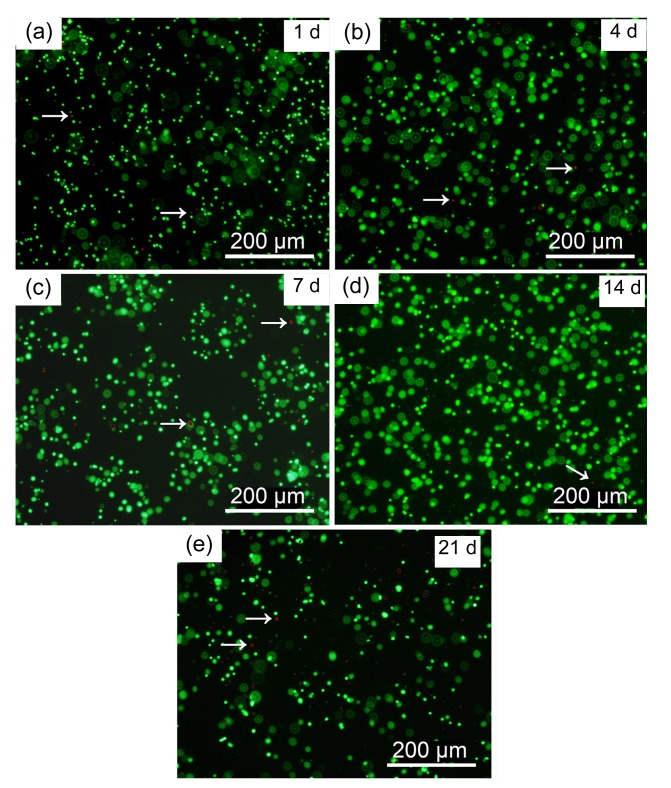
Fig. 4.
Fluorescent images of live/dead staining of A-cell microcapsules
Cultured A-cell microcapsules at Days 1 (a), 4 (b), 7 (c), 14 (d), and 21 (e). Green dots: live cells; Red dots (arrows): dead cells (Note: for interpretation of the references to color in this figure legend, the reader is referred to the web version of this article)

