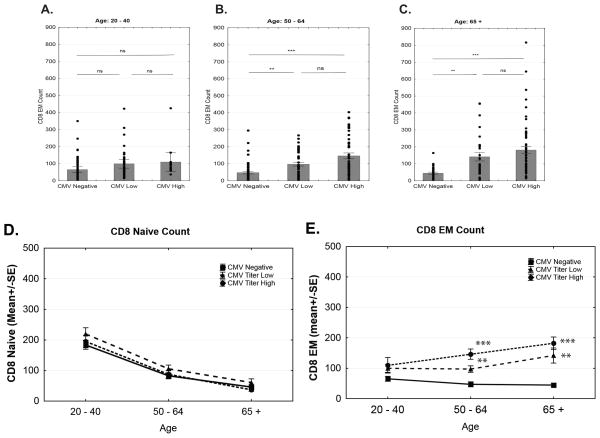
Figure 7. CD8 EM expansion is dependent upon CMV Titer and Age.
Results shown in Figs. 2 & 3 were plotted against anti-CMV Ab titers by separating the cohort (n=391) into upper and lower anti-CMV Ab titer half (lower<349>upper); multiple regression model with age and CMV status as covariates was used to calculate significance. CD8 EM numbers are shown for anti-CMV titer hi, lo and CMV(−): A, for individuals 40y and younger; B, individuals 50–64yrs of age; and C, for individuals 65yrs of age and older. D. Slope of absolute naïve CD8 cells count over age groups. E. Slope of absolute EM T cell inflation over age groups. Data from CMV−, CMVAblo and CMVAbhi subjects are shown in solid line/squares, dashed line/triangels and dotted line/circles, respectively. Significance ** p=0.01 to p=0.001, ***p>0.001 was determined by two-way ANOVA followed by Bonferroni correction for multiple comparisons. NS= not significant.

