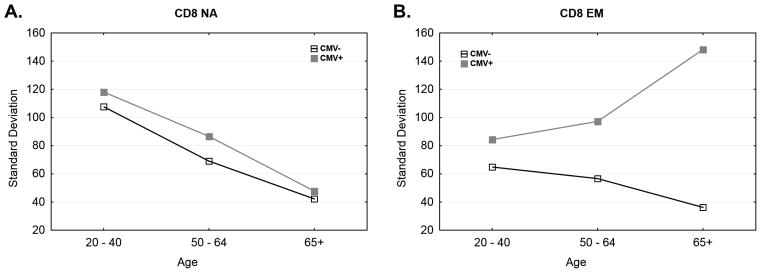
Figure 9. Variance in Absolute Count of Naïve Pool Declines with Advancing Age Independent of CMV Status; Variance Increases Significantly in aged CMV+ donor subset.
Plots show the standard deviation of absolute naïve (A) and EM (B) T cell counts. N=391; CMV(+) = 239. CMV(−) =152. Absolute T cell inflation over age from CMV− (dark line, open squares) and CMV+ (gray line, closed squares) subjects.

