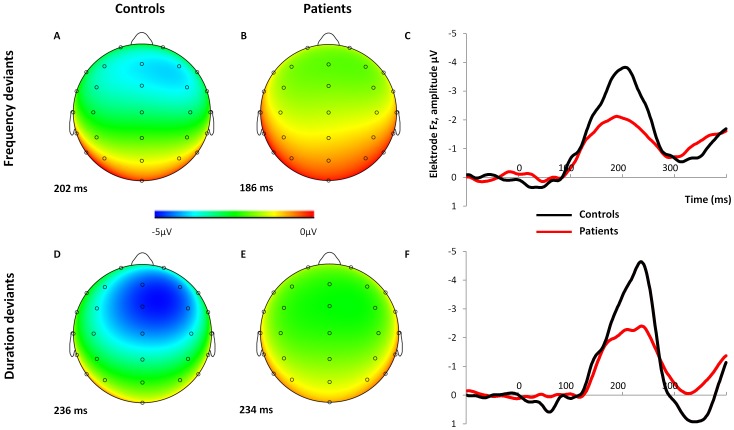
Figure 2. 28 channel EEG amplitude distributions and comparison of the between-group MMN waveforms.
Scalp electrode maps of MMN to frequency deviant (A, B) and duration deviant tones (D, E) in controls (A, D) and patients (B, E). MMN waveforms of patients and controls to frequency (C) and duration deviant tones (F), both at Fz are shown on the right.

