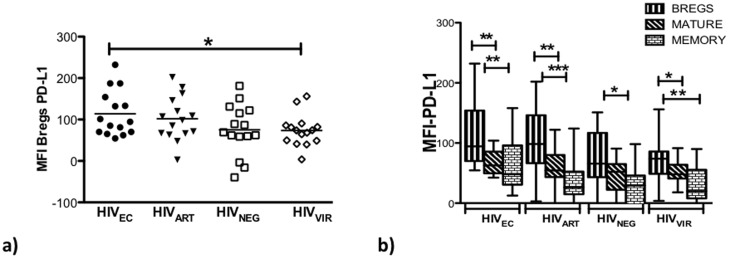
Figure 5. Bregs from HIVEC and HIVART subjects exhibit comparable endogenous levels of PD-L1.
In PBMC (n = 15) of HIVEC, HIVART, HIVNEG, and HIVVIR, endogenous levels of PD-L1 expression on (a) Bregs and (b) Bregs compared to the other B-cell subsets were determined by flow cytometry. Boxes represent 25th to 75th percentiles, whiskers indicate minimum and maximum values and the lines indicate the median. P values (Graphpad Prism software) are indicated; * = p<0.05, ** = p<0.005, *** = p<0.0005.

