
Figure 6. A comparison of time evolutions of phase lags and their motion in the 2D space of phase differences.

(A) Time evolutions of the phase lags,  (gray) and
  (blue), exponentially converging to phase locked states after 50 burst cycles with short duty cycle,
  . (B) The corresponding Poincaré phase lag map revealing three stable FPs (shown in blue, red and green) at
 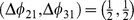 ,
,  ,
,  and two unstable FPs (dark dots) at
  and
and  . The attractor basins of the three stable FPs are color coded by the color of the FP, and are separated by the separatrices of six saddle FPs (smaller dots). Arrows on representative lines that connect iterates indicate the forward direction of iterates. See note at the end of Methods regarding interpretation of the lines and colors.