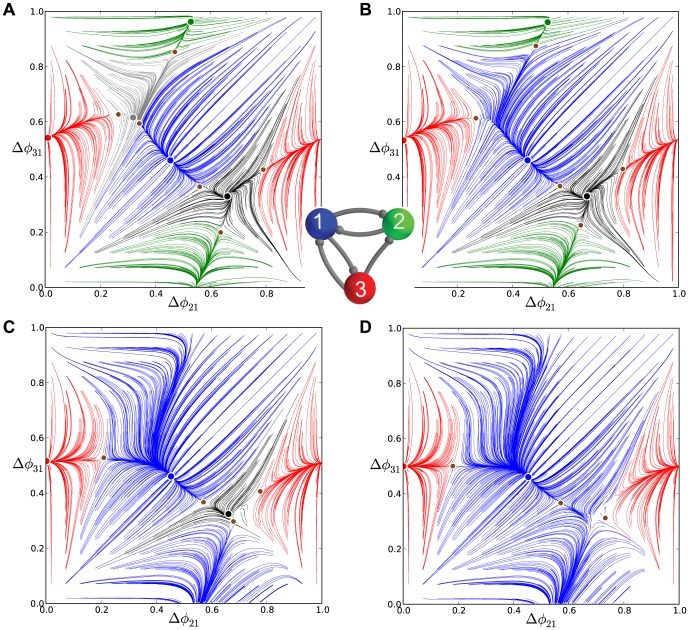
Figure 15. Transformation stages of the phase lag maps for the pyloric circuit motif.
Here, a single connection  decreases from
  ,
,  and
and  through to
  in (A)–(D), respectively. Going from (A) to (B), a triplet of saddle-node bifurcations eliminate first the clockwise
  FP, and then subsequently the green FP at
  in (B) to (C). The growing domain of the dominant blue FP at
  widens further from (C) to (D) after the stable counter-clockwise,
  , FP is annihilated through the final saddle-node bifurcation.

