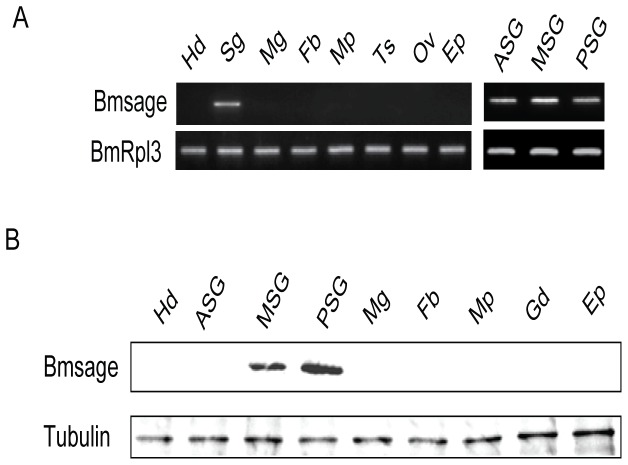
Figure 2. Bmsage expressed specifically in silk glands of B. mori.
A. Expression level of Bmsage in different tissues of B. mori on day 3 of 5th instar larvae by semiquantitative RT-PCR. BmRpl3 expression is shown as a control. B. Protein level of Bmsage in different tissues of B. mori on day 3 of 5th instar larvae. Tubulin is shown as a control. Different tissues are shown as: Hd, Head; ASG, Anterior silk gland; MSG, Middle silk gland; PSG, Posterior silk gland; Mg, Midgut; Fb, Fatbody; Mp, Malpighian; Gd, Gonad; Ep, Epidermis.

