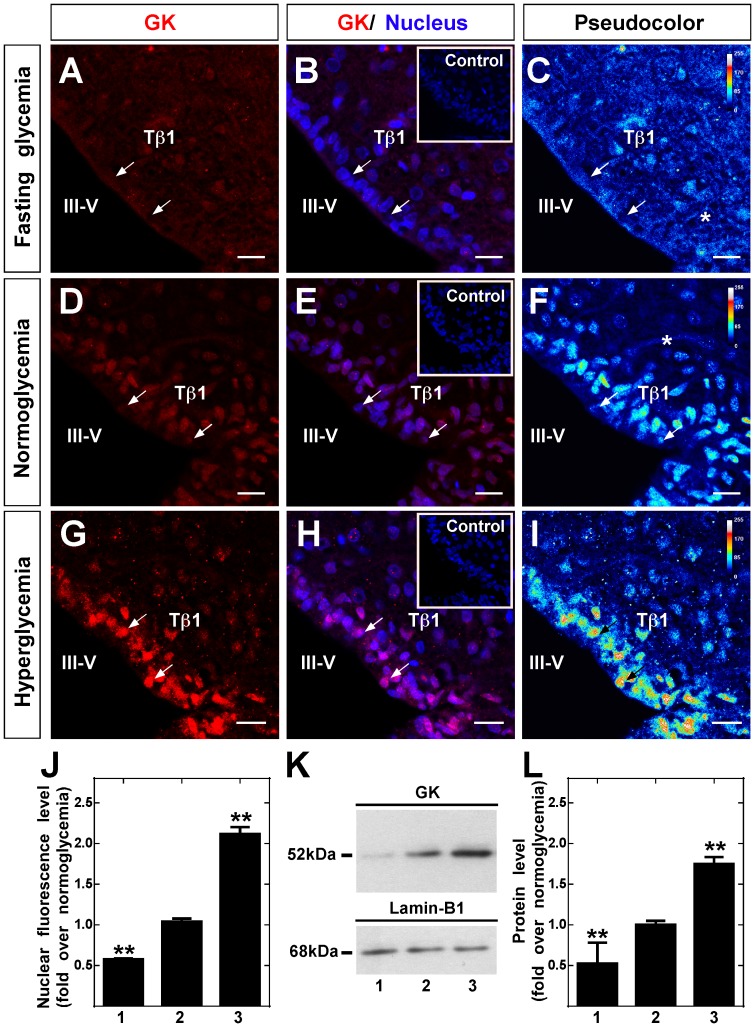
Figure 1. Immunolocalization and Western blot analysis of hypothalamic GK.
A-I, Frontal sections of rat hypothalamus were obtained from animals exposed to different glycemic conditions and were immunostained with rabbit anti-GK (1∶100). Fasting (A–C), normoglycemia (D–F) and hyperglycemia (G–I). C, F and I, semi-quantitative analysis of GK immunofluorescence by pseudocolor (blue, negative signal; yellow, medium signal; red, high signal). Inserts in B, E and H correspond to the immunoreaction using anti-GK preabsorbed with inductor peptides. J, Quantitative analysis of nuclear intensity of tanycyte GK in different glycemic conditions. Statistical analysis was performed using the one way ANOVA-Dunnet test; P-values<0.05 were considered significant. Data represent the average fluorescence intensity of GK-positive nuclei in a total of 200 tanycytes obtained from five animals per condition. K, Immunoblots of GK (52 kDa, upper-panel) and lamin-B1 (68 kDa, lower panel) in nuclear protein extracts obtained in different glycemic conditions. L, Quantitative analysis of GK nuclear expression relative to lamin-B1. The nuclear localization of GK increased gradually in response to glycemia. Statistical analysis was performed using the one way ANOVA-Dunnet test; P-values<0.05 were considered significant. J-L, 1-3 represent fasting, normoglycemic and hyperglycemic conditions, respectively. Data represent the means±SD from six independent determinations. III-V: third ventricle; Tβ1: β1 tanycytes. Scale bars, 25 µm.

