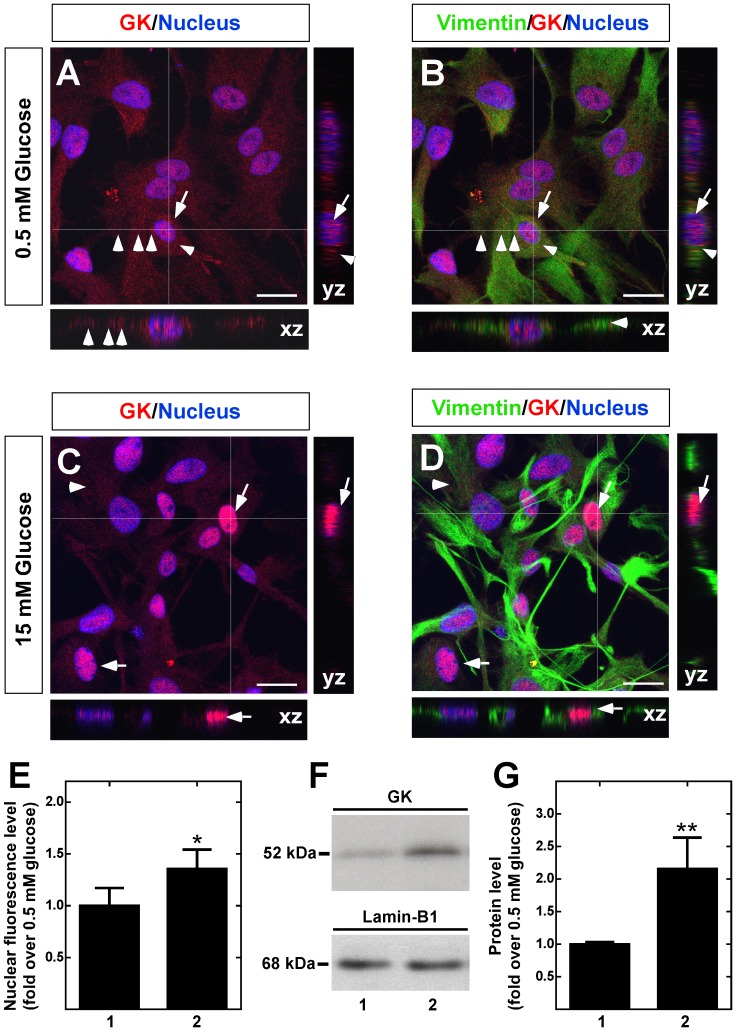
Figure 6. Dynamic localization of GK in cultured tanycytes in response to glucose.
A–D. GK immunolocalization (red) in tanycytes preincubated with 0.5 mM glucose for 6 h (A–B) or incubated with 15 mM glucose for 30 min (C–D). Nuclei (A–C) and Vimentin (B, D) are stained in blue and green, respectively. Arrows and arrowheads show nuclear and cytoplasmic GK localization, respectively. Images were obtained by Z-stack reconstruction, and white lines indicate orthogonal planes (XZ and YZ) shown in the lateral and lower panels. E, Nuclear intensity of GK immunofluorescence in tanycytes cultured in the presence of 0.5 mM (lane 1) and 15 mM (lane 2) glucose. The results represent the mean±sd of 200 cells from three independent primary cultures. F, Immunoblots of GK (52 kDa, upper panel) and the nuclear marker, lamin-B1 (68 kDa, lower panel), in nuclear extracts obtained from cells cultured with 0.5 mM (lane 1) and 15 mM (lane 2) glucose. G, GK nuclear expression levels assessed by western-blot were quantified and normalized with lamin-B for cells cultured with 0.5 mM (lane 1) and 15 mM (lane 2) glucose. The data shows the means±SD from six independent experiments. * p<0.05; ** p<0.01. Scale bar in A–D, 50 µm.

