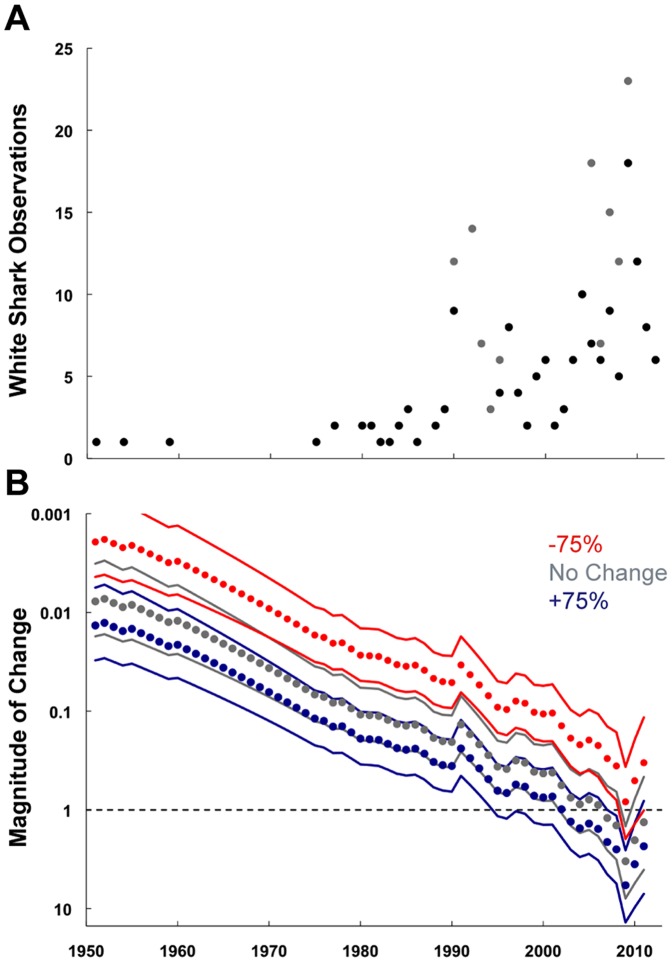
Figure 4. Population trend analysis.
A) White shark observations by year. Black circles indicate data included in population trend analysis. Gray circles indicate data from focused monitoring in Japan that was excluded prior to undertaking the analysis. B) Estimates of changes in relative abundance for any reference year between 1951–2011 under different assumptions of trends in observation effort.

