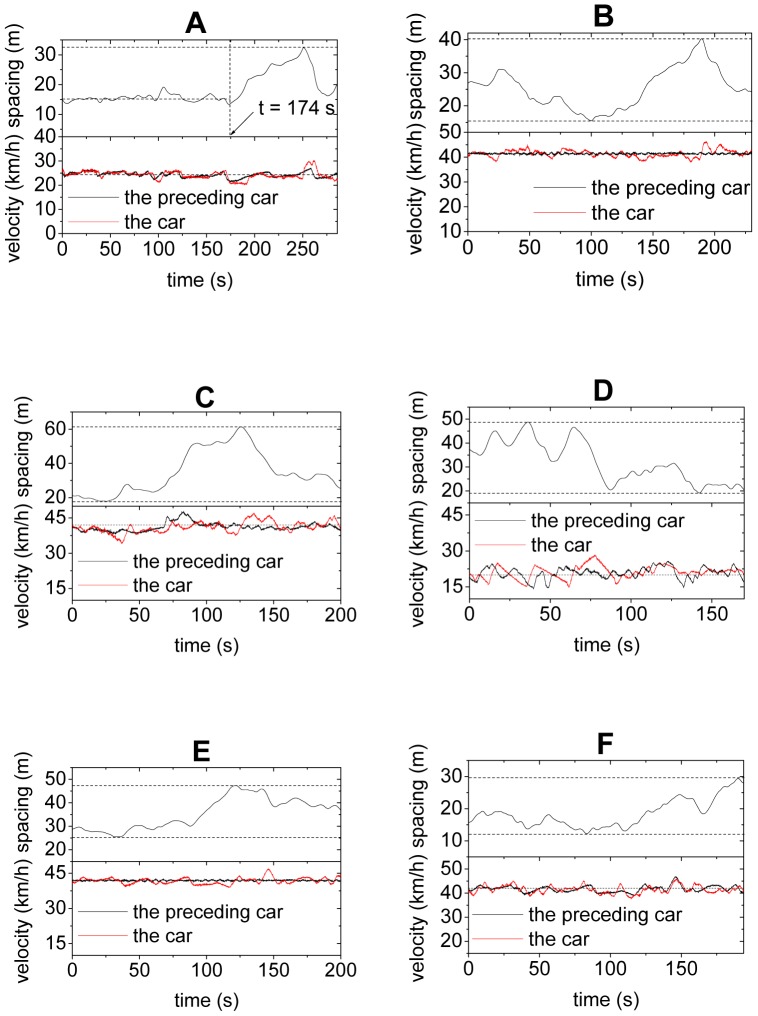
Figure 2. Evolution of velocities of a car and its preceding car and their spacing.
Panels A and B show Car No.st set of experiment, Panel C shows Car No. 2 in the 1st set of experiment, Panel D shows Car No. 23 in the 1st set of experiment, Panel E shows Car No. 11 in the 2nd set of experiment, Panel F shows Car No. 12 in the 2nd set of experiment. See Table 1 for the sequence of the cars in the platoon in the two sets of experiment.

